


Jessie A Ellis
Sep 28, 2025 10:26
OM price trades at $0.17 with 0.97% daily gains, but technical indicators reveal oversold conditions as MANTRA tests critical support levels around $0.15.
Quick Take
• OM currently trading at $0.17 (+0.97% in 24h)
• MANTRA’s RSI at 34.26 indicates oversold conditions with potential reversal signals
• No significant news events in past week, price action driven by technical factors
What’s Driving MANTRA Price Today?
The OM price movement today appears primarily driven by technical factors rather than fundamental catalysts, with no significant news events reported in the past seven days. This absence of major announcements has left MANTRA’s price action to be dictated by chart patterns and technical indicators.
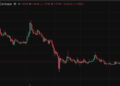
The modest 0.97% gain in the past 24 hours represents a slight recovery attempt, but the broader context reveals MANTRA remains under significant pressure. Trading within a range of $0.16 to $0.19 over the past day, OM has struggled to break above key resistance levels while maintaining support near current levels.
Volume data from Binance spot market shows $17.7 million in daily trading activity, indicating moderate interest despite the lack of fundamental catalysts. This volume suggests traders are positioning based on technical levels rather than reacting to news flow.
OM Technical Analysis: Mixed Signals with Oversold Momentum
MANTRA technical analysis reveals a complex picture with several conflicting signals that traders need to carefully evaluate. The most prominent indicator is OM RSI at 34.26, placing MANTRA firmly in oversold territory. This RSI reading typically suggests selling pressure may be exhausted and a potential bounce could materialize.
However, MANTRA’s moving averages paint a different story. The OM price currently sits below all major moving averages, with the SMA 20 at $0.20 and SMA 50 at $0.22 acting as immediate resistance levels. Most concerning is the vast gap to the SMA 200 at $1.26, highlighting the significant distance from longer-term bullish territory.
The MACD indicator for MANTRA shows bearish momentum with a reading of -0.0150, while the MACD histogram at -0.0032 confirms the negative trend continues. OM’s Stochastic indicators (%K at 18.01, %D at 22.11) also reflect oversold conditions, aligning with the RSI signal.
MANTRA’s Bollinger Bands provide additional context, with OM trading near the lower band at $0.15. The %B position of 0.1315 indicates MANTRA is approaching the lower boundary of its recent trading range, often a level where technical bounces occur.
MANTRA Price Levels: Key Support and Resistance
The current OM price structure reveals critical levels that will determine MANTRA’s near-term direction. MANTRA support levels appear concentrated around the $0.15 zone, which aligns with both the immediate and strong support levels identified in the technical analysis.
This $0.15 level represents a crucial test for OM, as it coincides with the 52-week low and the lower Bollinger Band. A break below this MANTRA support could trigger additional selling pressure and potentially drive OM toward new lows.
On the resistance side, OM faces immediate challenges at $0.23, followed by the stronger resistance at $0.30. The $0.23 level roughly aligns with the SMA 20, making it a significant hurdle for any recovery attempt. Breaking above this level would need to be accompanied by increased volume to signal a meaningful shift in sentiment.
The pivot point at $0.17 serves as the current equilibrium level, with OM price action likely to remain volatile around this zone until a clear directional break occurs.
Should You Buy OM Now? Risk-Reward Analysis
Based on Binance spot market data, the risk-reward profile for MANTRA presents both opportunities and significant hazards that vary depending on trading approach and risk tolerance.
For aggressive traders, the oversold conditions reflected in OM RSI readings could present a short-term bounce opportunity. The proximity to strong support at $0.15 offers a relatively tight stop-loss level, potentially creating an attractive risk-reward ratio for those betting on a technical reversal.
Conservative investors should exercise caution given MANTRA’s position below all major moving averages and the overall weak bullish trend classification. The distance to meaningful resistance levels suggests any recovery could be limited and face multiple overhead barriers.
Swing traders might consider waiting for a clear break above the $0.20 level (SMA 20) before establishing positions, as this would signal MANTRA has reclaimed its short-term moving average support. Conversely, a break below $0.15 would likely trigger stop-losses and create additional downside pressure.
The high volatility indicated by the Daily ATR of $0.02 suggests position sizing should account for potential rapid price movements in either direction.
Conclusion
MANTRA’s current position at $0.17 represents a critical juncture where oversold technical indicators clash with bearish trend structure. While OM RSI suggests potential for a bounce, the broader technical picture remains challenging with resistance levels clustered above current prices. Traders should monitor the $0.15 support level closely, as a break below could accelerate selling pressure, while a hold above this level combined with improving momentum indicators could signal a short-term reversal opportunity. The next 24-48 hours will likely determine whether MANTRA can stabilize and attempt a recovery or succumb to further downside pressure.
Image source: Shutterstock
Credit: Source link


