


Tony Kim
Sep 15, 2025 13:40
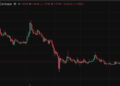
OM price falls to $0.21 with bearish momentum, but MACD histogram shows potential bullish divergence as key support holds at $0.19 level.
Quick Take
• OM currently trading at $0.21 (-4.96% in 24h)
• MANTRA’s RSI at 40.98 suggests oversold conditions may be approaching
• No significant news catalysts identified in recent trading sessions
• Technical indicators present mixed signals with neutral overall trend
What’s Driving MANTRA Price Today?
The OM price decline appears to be driven primarily by broader market sentiment rather than specific fundamental catalysts. With no significant news events reported for MANTRA in the past week, the current price action reflects technical trading patterns and general cryptocurrency market dynamics.
The lack of fresh catalysts has left OM vulnerable to profit-taking after previous gains, with the token now testing important support levels. Trading volume on Binance spot market reached $10.4 million over the past 24 hours, indicating moderate interest despite the downward pressure.
OM Technical Analysis: Mixed Signals Emerge
MANTRA technical analysis reveals a complex picture with competing bullish and bearish indicators. The OM RSI currently sits at 40.98, approaching oversold territory but not yet signaling an immediate reversal. This neutral positioning suggests MANTRA could move in either direction based on market sentiment.
The MACD histogram shows a positive reading of 0.0020, indicating potential bullish momentum building beneath the surface despite the overall negative MACD reading of -0.0062. This divergence often precedes trend changes and warrants close monitoring by OM traders.
MANTRA’s moving averages paint a bearish picture with the current price below most key levels. The OM price trades below the 7-day SMA at $0.22 and significantly under the 50-day SMA at $0.24. However, the proximity to the 20-day SMA at $0.21 suggests potential support.
The Bollinger Bands analysis shows MANTRA trading in the lower portion of the range with a %B position of 0.30, indicating the token is closer to oversold conditions. The OM price currently sits near the middle band at $0.21, with room to move toward either the upper band at $0.23 or lower band at $0.20.
MANTRA Price Levels: Key Support and Resistance
Critical MANTRA support levels emerge at $0.19, representing both immediate and strong support according to technical analysis. This level has proven significant in recent trading and aligns closely with the 52-week low of $0.20, making it a crucial area for OM bulls to defend.
On the upside, OM resistance appears at $0.25 for immediate challenges, with stronger resistance at $0.30. Breaking above the immediate resistance would likely target the upper Bollinger Band near $0.23 first, before attempting the more significant $0.25 level.
The current pivot point sits exactly at the OM price of $0.21, suggesting this level serves as a critical decision point for near-term direction. Traders should watch for sustained moves above or below this level to gauge momentum.
Should You Buy OM Now? Risk-Reward Analysis
Based on Binance spot market data, the current setup presents different opportunities for various trading approaches. Conservative investors might wait for a clear break above $0.22 resistance or a successful test of $0.19 support before establishing positions.
Active traders could consider the potential bullish MACD divergence as an early signal, but should implement strict risk management with stops below $0.19. The proximity to the 52-week low provides a favorable risk-reward ratio for those believing in MANTRA’s longer-term prospects.
Swing traders should monitor the OM/USDT pair for a break above the 7-day SMA at $0.22, which could signal a short-term trend reversal. However, the overall bearish market context suggests maintaining smaller position sizes until clearer directional signals emerge.
Conclusion
MANTRA faces a critical juncture at current levels, with the OM price testing important technical support near recent lows. While the immediate outlook remains neutral to slightly bearish, emerging bullish signals in the MACD histogram and approaching oversold RSI conditions suggest potential for a bounce in the next 24-48 hours. Traders should watch for either a decisive break below $0.19 support or a recovery above $0.22 resistance to guide their next moves in this consolidation phase.
Image source: Shutterstock
Credit: Source link


