


Caroline Bishop
Sep 14, 2025 13:45
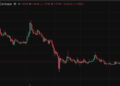
OM price drops 3.03% to $0.22 amid neutral technical signals, with MANTRA trading near key pivot levels as momentum indicators show conflicting signals for traders.
Quick Take
• OM currently trading at $0.22 (-3.03% in 24h)
• MANTRA’s RSI at 46.66 indicates neutral momentum with no clear directional bias
• No significant news catalysts driving price action in the past week
What’s Driving MANTRA Price Today?
The OM price decline of 3.03% over the past 24 hours appears to be driven primarily by broader market sentiment rather than specific fundamental catalysts. With no significant news events affecting MANTRA in the past seven days, the current price action reflects technical positioning and general cryptocurrency market dynamics.
The absence of fresh catalysts has left OM vulnerable to profit-taking pressure, particularly as the token trades within a relatively tight range between $0.22 and $0.23. This lack of directional momentum suggests that MANTRA investors are waiting for clearer signals before making significant moves.
Based on Binance spot market data, the $10.36 million in 24-hour trading volume indicates moderate interest levels, though this represents a typical range for OM/USDT trading activity. The current price action suggests consolidation rather than any dramatic shift in market sentiment.
OM Technical Analysis: Neutral Signals Create Trading Uncertainty
MANTRA technical analysis reveals a mixed picture that’s keeping traders on the sidelines. The OM RSI reading of 46.66 sits firmly in neutral territory, indicating neither overbought nor oversold conditions. This RSI level suggests that MANTRA has room to move in either direction without immediate momentum constraints.
The MACD indicator presents conflicting signals for OM traders. While the main MACD line sits at -0.0058 in negative territory, the MACD histogram has turned positive at 0.0030, suggesting that bearish momentum may be weakening. This divergence often precedes trend changes, making it a critical indicator to watch for MANTRA price direction.
MANTRA’s moving averages paint a complex picture. The OM price currently trades above both the 7-day SMA ($0.22) and 20-day SMA ($0.21), indicating short-term strength. However, the token remains well below the 50-day SMA at $0.24, highlighting the ongoing downtrend from higher levels.
The Bollinger Bands analysis shows OM positioned at 0.5784 between the bands, with the upper band at $0.23 and lower band at $0.20. This middle positioning reinforces the neutral technical outlook, as MANTRA isn’t testing either extreme that might signal breakout potential.
MANTRA Price Levels: Key Support and Resistance
Current technical levels suggest several critical zones for OM traders to monitor. The immediate resistance level sits at $0.25, representing a 13.6% upside from current levels. Breaking above this level could signal renewed bullish momentum for MANTRA, potentially targeting the stronger resistance zone at $0.30.
MANTRA support levels present a more concerning picture for bulls. The immediate support at $0.19 represents only a 13.6% downside buffer, while the strong support level also sits at $0.19. This clustering of support suggests that any breakdown below $0.19 could lead to more significant selling pressure.
The current pivot point analysis places OM right at the $0.22 equilibrium level, reinforcing the neutral technical stance. This positioning means that MANTRA could easily move toward either the resistance or support levels based on market catalysts or momentum shifts.
Should You Buy OM Now? Risk-Reward Analysis
For aggressive traders, the current OM price setup offers a defined risk-reward scenario. Entry at $0.22 with a stop-loss at $0.19 provides a 13.6% downside risk, while the first resistance target at $0.25 offers 13.6% upside potential. The 1:1 risk-reward ratio makes this a marginal setup that requires careful position sizing.
Conservative investors might prefer waiting for clearer directional signals before establishing positions. The neutral RSI and mixed MACD readings suggest that MANTRA could remain range-bound in the near term, making it less attractive for momentum-based strategies.
Swing traders should note that OM volatility, as measured by the Average True Range (ATR) of $0.01, remains relatively low. This suggests that any significant moves may take time to develop, requiring patience for position management.
The dramatic difference between MANTRA’s 52-week high of $8.50 and the current OM price of $0.22 illustrates the token’s potential volatility. While this represents a 97% decline from peaks, it also suggests significant upside potential if market conditions improve and fundamental catalysts emerge.
Conclusion
MANTRA’s current technical position at $0.22 reflects a market in equilibrium, with neither bulls nor bears maintaining clear control. The OM price faces immediate resistance at $0.25 and support at $0.19, creating a relatively narrow trading range for the next 24-48 hours. Traders should monitor the MACD histogram for signs of momentum change while watching for any fundamental developments that could break the current consolidation pattern. Without fresh catalysts, MANTRA appears likely to remain range-bound until clearer directional signals emerge from either technical indicators or market-moving news.
Image source: Shutterstock
Credit: Source link


