


Zach Anderson
Sep 05, 2025 11:09
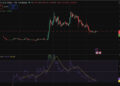
OM price currently at $0.21 with 4.33% daily gains, but technical indicators reveal conflicting signals as MANTRA tests critical support levels.
Quick Take
• OM currently trading at $0.21 (+4.33% in 24h)
• MANTRA’s RSI at 41.11 signals neutral momentum with potential oversold bounce
• No major catalysts in past week, price action driven by technical factors
What’s Driving MANTRA Price Today?
The OM price action over the past 24 hours reflects a market largely driven by technical factors rather than fundamental catalysts. With no significant news events reported in the past week, MANTRA’s 4.33% daily gain appears to be a technical bounce from the $0.20 support level that coincides with the coin’s 52-week low.
The current price movement suggests traders are positioning around key technical levels, with the OM/USDT pair showing increased activity as it tests the lower boundary of its recent trading range. The lack of fresh fundamental drivers means technical analysis becomes even more crucial for understanding MANTRA’s next potential move.
OM Technical Analysis: Mixed Signals Emerge
MANTRA technical analysis reveals a complex picture with conflicting indicators pointing in different directions. The OM RSI reading of 41.11 sits in neutral territory, neither oversold nor overbought, suggesting the recent bounce could have room to continue before hitting resistance.
However, MANTRA’s MACD presents a more bearish outlook with a reading of -0.0135 and a histogram showing -0.0019, indicating bearish momentum remains intact despite today’s gains. The MACD signal line at -0.0116 suggests the bearish crossover is still influencing price action.
The moving average structure tells a concerning story for OM bulls. MANTRA’s price trades below all major moving averages except the 7-day SMA at $0.21. The significant gap between the current OM price and the 200-day SMA at $2.07 highlights the extent of the recent decline from higher levels.
MANTRA’s Bollinger Bands show the coin trading near the lower band at $0.19, with a %B position of 0.2542 indicating oversold conditions that could support a short-term bounce toward the middle band at $0.23.
MANTRA Price Levels: Key Support and Resistance
Based on Binance spot market data, MANTRA support levels cluster around the current trading zone. The immediate OM support sits at $0.19, which aligns with both the Bollinger Band lower boundary and the 52-week low. A break below this level could trigger further selling pressure toward the strong support at $0.19.
On the upside, OM resistance appears at $0.26, corresponding to the Bollinger Band upper boundary and recent swing highs. This level represents the first major hurdle for any sustained recovery attempt. Beyond that, MANTRA faces stronger resistance at $0.40, though reaching this level would require significant fundamental catalysts given the current technical setup.
The pivot point at $0.21 serves as the immediate battleground, with the OM price currently testing this level. How MANTRA reacts around this pivot will likely determine the short-term direction.
Should You Buy OM Now? Risk-Reward Analysis
For swing traders, the current OM price presents a high-risk, high-reward scenario. The proximity to 52-week lows offers attractive entry levels for those betting on a technical bounce, but the bearish MACD and moving average structure suggest caution.
Conservative traders might wait for MANTRA to reclaim the $0.23 level (20-day SMA) before considering long positions. This would demonstrate the ability to break above immediate resistance and potentially shift the technical narrative.
Day traders could consider the $0.19-$0.21 range for scalping opportunities, using tight stops below the strong support level. The daily ATR of $0.02 provides guidance for position sizing and risk management.
Risk management remains crucial given MANTRA’s proximity to major support. Any position should include stops below $0.19 to limit downside exposure if the support fails to hold.
Conclusion
The OM price sits at a critical juncture with today’s 4.33% gain providing temporary relief from recent selling pressure. While MANTRA technical analysis shows mixed signals, the neutral RSI and oversold Bollinger Band position suggest potential for further short-term gains toward $0.23-$0.26 resistance.
However, the bearish MACD and weak moving average structure indicate any rally may be limited without fresh fundamental catalysts. Traders should watch how OM reacts around the $0.21 pivot point over the next 24-48 hours for directional clues.
Image source: Shutterstock
Credit: Source link


