


Iris Coleman
Sep 04, 2025 09:56
OM price holds critical $0.20 support despite 8% weekly gains, with technical indicators showing mixed signals after $25M buyback announcement.
Quick Take
• OM currently trading at $0.20 (-2.35% in 24h)
• MANTRA’s RSI at 35.81 suggests oversold conditions with potential reversal
• $25 million token buyback commitment provides fundamental support
• OM price testing critical support levels with bearish MACD momentum
What’s Driving MANTRA Price Today?
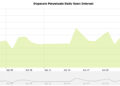
The OM price action over the past week tells a story of initial optimism followed by technical consolidation. The primary catalyst was MANTRA’s announcement on August 28 of a $25 million funding commitment specifically for OM token buybacks, designed to strengthen institutional confidence in their real-world asset ecosystem. This news initially drove an 8% rally that pushed OM price toward weekly highs near $1.00.
However, the momentum has since stalled as OM price consolidated back to the $0.20 level by September 3. The current price action suggests that while the buyback announcement provided fundamental support, technical factors are now taking precedence in determining short-term direction. Trading volume on Binance spot has remained healthy at $6.32 million over the past 24 hours, indicating continued interest despite the recent pullback.
The consolidation at $0.20 represents a critical juncture for MANTRA, as this level coincides with both the 52-week low and a key psychological support zone that has been tested multiple times in recent sessions.
OM Technical Analysis: Mixed Signals Emerge
MANTRA technical analysis reveals a complex picture with conflicting indicators that traders need to carefully consider. The most significant bearish signal comes from MANTRA’s MACD, which shows a reading of -0.0140 with a bearish histogram of -0.0029, indicating weakening momentum despite the recent rally attempt.
However, OM RSI provides a more constructive outlook at 35.81, placing MANTRA firmly in oversold territory without reaching extreme levels. This OM RSI reading suggests that selling pressure may be exhausting, potentially setting up for a relief rally if other conditions align favorably.
The moving average structure presents additional challenges for bulls, with OM price currently trading below all short and medium-term averages. MANTRA’s SMA 7 sits at $0.21, while the SMA 20 and SMA 50 are positioned at $0.23 and $0.25 respectively, creating multiple resistance layers above current levels.
MANTRA’s Bollinger Bands analysis shows OM price near the lower band at $0.19, with a %B position of 0.0890 indicating the token is trading in the lower portion of its recent range. This positioning often coincides with oversold conditions and potential bounce opportunities.
MANTRA Price Levels: Key Support and Resistance
Based on Binance spot market data, MANTRA support levels are clearly defined with immediate support at $0.19 coinciding with both the Bollinger Band lower boundary and the 52-week low. This level has proven resilient in recent trading sessions and represents the most critical support zone for OM price in the near term.
Should this MANTRA support level fail, the next significant floor appears much lower, making the current $0.19-$0.20 zone particularly important for maintaining the overall structure. The daily ATR of $0.02 suggests that moves beyond this range could be significant.
On the resistance side, OM faces immediate challenges at $0.26, which corresponds to the Bollinger Band upper boundary and aligns with previous support-turned-resistance. Above this level, MANTRA resistance strengthens significantly at $0.40, representing a key psychological and technical barrier that would need to be overcome for any sustained upward movement.
The current pivot point at $0.20 serves as the immediate battleground between bulls and bears, with price action around this level likely to determine the short-term direction for OM.
Should You Buy OM Now? Risk-Reward Analysis
For aggressive traders, the current OM price setup offers an asymmetric risk-reward opportunity, but with significant caveats. The combination of oversold OM RSI conditions and the fundamental support from the $25 million buyback program creates a potentially attractive entry point for those willing to accept high risk.
A strategic approach would involve entering near the $0.19-$0.20 MANTRA support levels with tight stop-losses below $0.18. The initial target would be the $0.26 resistance level, offering approximately 30% upside potential against a manageable 10% downside risk to the stop-loss level.
Conservative investors should wait for clearer technical confirmation before considering OM positions. Specifically, a sustained break above $0.26 with increasing volume would provide better evidence that MANTRA has established a new upward trajectory. The bearish MACD momentum suggests that any immediate rallies could face significant resistance.
For existing OM holders, the $25 million buyback commitment provides fundamental justification for maintaining positions, but the technical picture suggests patience may be required before seeing significant gains. The key risk level remains the $0.19 support, below which MANTRA could face accelerated selling pressure.
Conclusion
MANTRA finds itself at a critical technical juncture with OM price defending crucial support at $0.20 while facing mixed signals from technical indicators. The recent $25 million buyback announcement provides fundamental underpinning, but near-term price action will likely be determined by whether MANTRA support levels can hold against bearish momentum indicators. Traders should monitor the $0.19-$0.20 zone closely over the next 24-48 hours, as a decisive break in either direction could set the tone for MANTRA’s next significant move. The oversold OM RSI suggests potential for a relief rally, but confirmation above $0.26 resistance would be needed to signal a meaningful trend change.
Image source: Shutterstock
Credit: Source link


