


Ethereum has surged to multi-year highs around $4,700, marking its strongest level since November 2021 and putting it within striking distance of its all-time high near $4,860. The rally has placed ETH on the verge of a price discovery phase, something the market hasn’t experienced in years. If bulls manage to push decisively beyond this key resistance, Ethereum could enter uncharted territory, with momentum potentially accelerating as traders and institutions pile in.
Related Reading
Fueling this bullish scenario is data from CryptoQuant showing Ethereum’s 30-day Simple Moving Average (SMA30) for exchange netflows at -40,000 ETH. This sustained negative reading means that, on average, 40,000 ETH per day have been withdrawn from exchanges over the past month. Negative netflows indicate stronger buying pressure, as tokens moved off exchanges are typically held in private wallets or deployed in staking and DeFi protocols — reducing the immediate sell-side supply.
The combination of a historically tight supply, strong on-chain accumulation, and technical strength near all-time highs has set the stage for a pivotal breakout. For traders, the coming sessions could determine whether Ethereum cements its status as the market leader in this cycle, or if it will face another round of consolidation before making its move into price discovery.
Ethereum Exchange Outflows Signal Strong Buying Pressure
According to top analyst Burak Kesmeci, Ethereum has seen 1.2 million ETH withdrawn from exchanges in just one month, marking one of the most significant accumulation trends in recent history. While headlines often highlight single-day spikes — like “100,000 ETH withdrawn from exchanges!” — Kesmeci stresses that these snapshots can be misleading. The real insight comes from observing sustained trends over time.
The Ethereum All Exchanges Netflow metric tracks the balance of inflows and outflows across all exchanges. Positive values represent ETH inflows, which can signal potential selling pressure as coins move onto exchanges. Negative values represent outflows, typically a sign that buying pressure dominates, as investors transfer coins to private wallets, staking contracts, or DeFi protocols.
In 2025, the SMA30 (30-day Simple Moving Average) of netflows has been firmly in negative territory, strengthening in recent weeks. As of August 12, 2025, the SMA30 stands at -40,000 ETH, meaning an average daily outflow of 40,000 ETH over the past month. This level of sustained withdrawal indicates strong conviction among holders.
As long as the SMA30 remains negative, Ethereum’s uptrend is likely to continue. A shift to positive territory could signal easing demand, but for now, the momentum remains firmly with the bulls. This trend reinforces the view that ETH’s rally still has room to run in the short term.
Related Reading
Price Action Details: Closing In On All-Time Highs
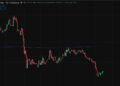
Ethereum (ETH) is trading at $4,691 on the weekly chart, posting a sharp 10.34% gain as bullish momentum accelerates. This rally has pushed ETH to its highest level since November 2021, bringing it within reach of its all-time high near $4,860. The breakout from the $3,860 resistance zone earlier this month was decisive, supported by strong volume, and now serves as a key support level.

Technical indicators show ETH well above its 50-week SMA ($2,776), 100-week SMA ($2,763), and 200-week SMA ($2,443), confirming a robust long-term uptrend. The slope of the 50-week SMA is turning sharply upward, reflecting the speed of recent gains.
Related Reading
If bulls can maintain momentum and break through $4,860, ETH would enter price discovery for the first time in nearly four years, potentially triggering an acceleration in buying activity. However, the $4,700–$4,860 range remains a historically significant resistance zone, and profit-taking could cause short-term pullbacks.
Featured image from Dall-E, chart from TradingView
Credit: Source link


