


Zach Anderson
Aug 10, 2025 11:23
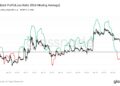
OM price trades at $0.27 after a 3.52% decline, with MANTRA technical analysis revealing bullish momentum despite recent weakness as traders watch critical levels.
Quick Take
• OM currently trading at $0.27 (-3.52% in 24h)
• MANTRA’s MACD histogram shows bullish momentum building
• No significant news catalysts driving recent price action
What’s Driving MANTRA Price Today?
The OM price movement over the past 24 hours appears driven primarily by technical factors rather than fundamental news, as no significant developments have emerged in the cryptocurrency space affecting MANTRA specifically. The 3.52% decline brings OM price from yesterday’s high of $0.29 down to current levels of $0.27, representing a natural pullback within the recent trading range.
Market participants are likely taking profits after MANTRA’s substantial recovery from its 52-week low of $0.20, while others may be positioning ahead of potential breakout moves. The current consolidation phase suggests traders are awaiting clearer directional signals before committing to larger positions in the OM/USDT pair.
OM Technical Analysis: Mixed Signals Emerge
MANTRA technical analysis reveals a complex picture with both bullish and neutral indicators present. The most compelling signal comes from MANTRA’s MACD, which shows a positive histogram reading of 0.0020, indicating building bullish momentum beneath the surface despite today’s price decline.
OM RSI currently sits at 54.41, positioning MANTRA squarely in neutral territory with room for movement in either direction. This RSI reading suggests neither overbought nor oversold conditions, giving the cryptocurrency flexibility for its next major move.
The moving average structure presents a mixed outlook for MANTRA. Short-term averages including the 7-day and 20-day SMAs both align at $0.27, matching the current OM price exactly. However, the 50-day SMA at $0.24 provides nearby support, while the 200-day SMA at $2.77 highlights the significant distance from longer-term trend levels.
MANTRA’s Bollinger Bands show OM price operating in the upper portion of the range, with the current level representing a %B position of 0.6057. This suggests MANTRA maintains relative strength within its recent trading envelope, though approaching the upper band at $0.30 could trigger resistance.
MANTRA Price Levels: Key Support and Resistance
Critical MANTRA support levels begin at $0.22 for immediate support, representing roughly an 18% decline from current OM price levels. Should this level fail, MANTRA strong support sits at $0.19, aligning closely with the recent 52-week low area.
On the upside, OM resistance appears at $0.34 as the immediate target, requiring a 26% advance from current levels. Breaking this level would open the path toward MANTRA strong resistance at $0.40, representing a potential 48% gain from today’s OM price.
The pivot point calculation places MANTRA at $0.28, just above current trading levels, suggesting the cryptocurrency maintains a slight bullish bias in the near term based on Binance spot market data.
Should You Buy OM Now? Risk-Reward Analysis
Conservative traders may want to wait for a clear break above $0.34 resistance before establishing long positions in MANTRA, as this would confirm the bullish momentum signals from the MACD indicator. Such traders could target the $0.40 resistance level while maintaining stops below the $0.22 immediate support.
Aggressive traders might consider the current OM price attractive given the bullish MACD divergence and neutral RSI conditions. These traders could enter positions around $0.27 with tight stops below $0.24 (the 50-day moving average) and initial targets at $0.30 (the Bollinger Band upper limit).
Risk management remains crucial given MANTRA’s high volatility, as evidenced by the Average True Range of $0.03, representing roughly 11% of the current OM price. Position sizing should account for this volatility when trading the OM/USDT pair.
Conclusion
MANTRA price action over the next 24-48 hours will likely depend on whether bulls can defend the $0.27 level and push OM price back toward the $0.30 resistance zone. The bullish MACD momentum provides hope for buyers, while the neutral RSI leaves room for upward movement. Traders should watch for volume confirmation on any breakout attempts, particularly given the substantial trading activity of over $15.5 million in the past 24 hours on Binance spot markets.
Image source: Shutterstock
Credit: Source link


