


Bitcoin has remained trapped in a tight range between $115K and $120K for the past 10 days, signaling an extended phase of price compression. With bulls unable to push the price above the $120,000 resistance, analysts are increasingly warning that a correction may be imminent. The coming days are expected to be decisive, as both technical and on-chain fundamentals point to a potential surge in volatility.
Related Reading
According to data from CryptoQuant, a key long-term metric—the Monthly Cumulative Days Destroyed (CDD) to Yearly CDD ratio—has reached an anomalously high level of 0.25. This is occurring within the $106,000 to $118,000 price range, a zone that has seen heavy long-term holder activity. Historically, similar CDD spikes were observed during the 2014 macro peak and the 2019 corrective phase, both of which marked periods of intense market distribution.
This unusual on-chain behavior reflects heightened movement of long-dormant coins, suggesting that experienced holders may be taking profits at current levels. While this doesn’t confirm an immediate trend reversal, it reinforces the idea that Bitcoin’s current consolidation is a critical inflection point—one that could either lead to renewed upside or trigger a deeper correction if bulls fail to regain momentum soon.
Long-Term Holders Begin Distributing, But Rally Still Intact
Top analyst Axel Adler has shared insights highlighting a key shift in Bitcoin market behavior: the sharp rise in the Monthly CDD to Yearly CDD ratio indicates that long-term holders (LTHs) are beginning to actively move dormant coins back into circulation. Historically, such elevated CDD levels have marked periods of heightened activity from experienced investors, often signaling a distribution phase where profits are realized after prolonged holding.
These spikes are significant because they suggest that coins held for years are now re-entering the market. According to Adler, this kind of activity isn’t random—it typically comes from holders with deep market knowledge who recognize potential turning points. However, this doesn’t necessarily mean the rally is over. While it may cap short-term upside and introduce volatility, current macro and institutional trends provide a solid counterbalance.
Treasury demand remains strong, and Bitcoin ETF inflows are still flowing steadily, acting as a buffer against excessive downward pressure. This structural support is crucial in maintaining overall bullish momentum, even as some distribution unfolds.
Related Reading
Sideways Movement Persists Below $120K Resistance
Bitcoin (BTC) continues to consolidate in a tight range, as shown in the 12-hour chart. Price action remains compressed between the $115,724 key support and the $122,077 resistance level. After a strong impulse earlier this month, momentum has clearly cooled, with BTC now oscillating within this horizontal channel for over 10 days.
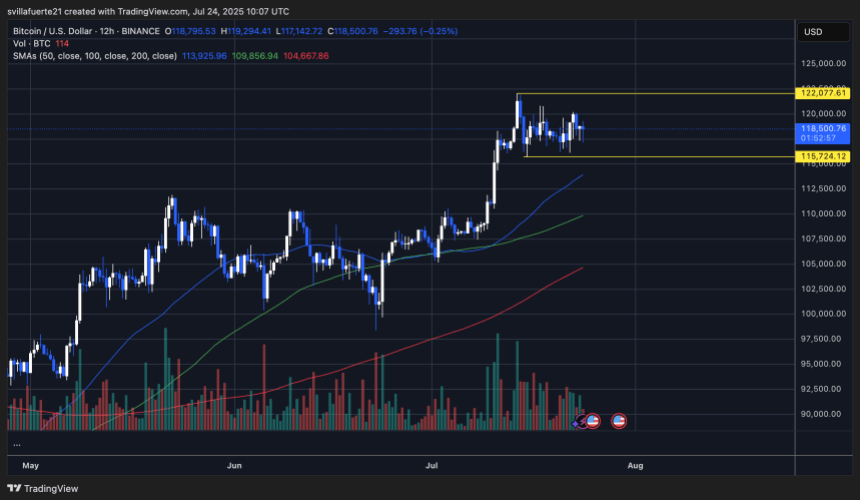
Notably, the price is currently hovering near $118,500—right around the 50-period moving average (blue), which has acted as dynamic support since early July. The 100-period (green) and 200-period (red) moving averages remain well below the current price, indicating that the broader trend remains bullish despite the pause in upward movement.
Related Reading
However, volume has steadily declined during this consolidation phase, signaling indecision and a potential lack of conviction among buyers at current levels. A breakout above $122,000 could renew bullish momentum, opening the door for a run toward new highs, while a breakdown below $115,700 would expose BTC to deeper retracement levels, likely targeting the 100 MA near $109,800.
Featured image from Dall-E, chart from TradingView
Credit: Source link


