• Live Crypto Prices
  • Crypto News
    • Worldwide
      • Bitcoin
      • Ethereum
      • Altcoin
      • Blockchain
      • Regulation
    • Australian Crypto News
  • Education
    • Cryptocurrency For Beginners
    • Where to Buy Cryptocurrency
    • Where to Store Cryptos
    • Cryptocurrency Tax in Australia 2021
No Result
View All Result
CryptoABC.net
No Result
View All Result

Is Bitcoin Price Turning Bullish Or Bearish? Crypto Analyst Reveals Critical Levels To Watch

May 15, 2025
in Bitcoin
Reading Time: 4min read
0 0
A A
0
Is Bitcoin Price Turning Bullish Or Bearish? Crypto Analyst Reveals Critical Levels To Watch
0
SHARES
0
VIEWS
ShareShareShareShareShare

Reason to trust

Strict editorial policy that focuses on accuracy, relevance, and impartiality

Created by industry experts and meticulously reviewed

The highest standards in reporting and publishing

Strict editorial policy that focuses on accuracy, relevance, and impartiality

Morbi pretium leo et nisl aliquam mollis. Quisque arcu lorem, ultricies quis pellentesque nec, ullamcorper eu odio.

Este artículo también está disponible en español.

Bitcoin’s price action in the past 24 hours has seen it slowly retracing from the $104,000 zone it started the week at. This range has become particularly significant as Bitcoin continues to flirt with levels last seen during its recent push toward new all-time highs. Bitcoin’s price movements over the past two days have tightened, and the candlestick behavior on the weekly chart has led to a doji formation on the weekly candlestick timeframe, an indicator of indecision.

Interestingly, a technical analysis from crypto analyst Tony “The Bull” Severino has highlighted critical levels to watch that will determine whether the Bitcoin price is turning bearish or still bullish. 

Mixed Signals: Why the Current Resistance Zone Is Critical

Crypto analyst Tony “The Bull” Severino shared a chart and in-depth breakdown on the social media platform X, pointing to horizontal support and resistance levels as the most important technical indicators in his view. As shown on his Bitcoin weekly chart, the leading cryptocurrency is now pressing against a well-defined resistance zone just below its all-time high, marked clearly in red. The proximity of this level to its all-time high means it could act as a ceiling, making it an important area to watch for either a breakout or a reversal.

Related Reading

Tony outlines three possible interpretations for the current market structure around the $108,000 resistance level. The bullish case hinges on Bitcoin consolidating under resistance, a pattern often followed by upward continuation. The neutral case is that Bitcoin could be forming a broad trading range, in which case it makes sense to short the market at resistance while buying near support. On the bearish side, the presence of a doji candlestick at this key level may be a sign of fading momentum and an early signal of a price reversal.

Bitcoin
Source: Tony Severino on X

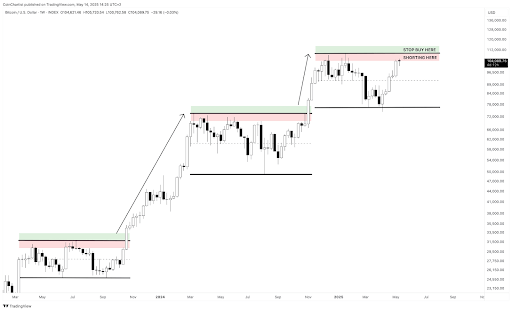
His trading strategy reflects this uncertainty. He has placed short positions within the red resistance zone, with a stop loss just above the all-time high. At the same time, he has set a stop buy order in the green breakout zone above the all-time high, ready to switch long should the Bitcoin price convincingly break through resistance.

Conditions For A Bullish Breakout Are Not Yet Fulfilled

Although Tony noted that the broader investment market, including altcoins and the stock market, looks strong, he cautioned that this does not guarantee a bullish breakout for Bitcoin. For confirmation, a bullish breakout must be preceded by aligning various technical indicators. These include a breakout with substantial trading volume, an RSI reading above 70 on the weekly chart, and a weekly close above the upper Bollinger Band. 

Related Reading

At the moment, however, the Bitcoin CME Futures chart has failed to move past 70 on the daily RSI twice, and trading volume is in decline. According to CoinMarketCap, the trading volume of Bitcoin is $44.33 billion in the past 24 hours, a 11.40% reduction from the previous 24 hours. These are early warning signs that a breakout attempt may lack the strength needed for sustainability.

Nonetheless, the conditions are still very mixed and starting to lean more bullish than bearish. At the time of writing, Bitcoin is trading at $102,352, down by 1.31% in the past 24 hours.

Bitcoin
BTC trading at $101,890 on the 1D chart | Source: BTCUSDT on Tradingview.com

Featured image from Pixabay, chart from Tradingview.com

Credit: Source link

ShareTweetSendPinShare
Previous Post

Ethereum Eyes $2.4K Retest – Analyst Sets Key Levels To Watch

Next Post

New Decentralized Gaming Token Skyrockets Following Binance Listing

Next Post
New Decentralized Gaming Token Skyrockets Following Binance Listing

New Decentralized Gaming Token Skyrockets Following Binance Listing

Leave a Reply Cancel reply

Your email address will not be published. Required fields are marked *

You might also like

BONK Poised For Liftoff As Bulls Target Long-Term SMA Breakout

BONK Poised For Liftoff As Bulls Target Long-Term SMA Breakout

May 11, 2025
Analyst Predicts Bitcoin Price Surge To $120,000 And Then A 50% Crash To $60,000, Here’s When

Analyst Predicts Bitcoin Price Surge To $120,000 And Then A 50% Crash To $60,000, Here’s When

May 13, 2025
XRP Pushes Past Tether amid BlackRock ETF Rumours

XRP Pushes Past Tether amid BlackRock ETF Rumours

May 13, 2025
Stablecoin Value to Overtake Current Crypto Market Cap, Citi Predicts

Stablecoin Value to Overtake Current Crypto Market Cap, Citi Predicts

May 14, 2025
Paolo Ardoino: Tether Tests New Bitcoin Mining Platform, Moria, with Enhanced Software Control

Understanding MACD: A Key Indicator for Spotting Momentum Shifts

May 10, 2025

Bitcoin’s $104,000 Peak Sparks High-Stakes Short Positions

May 13, 2025
CryptoABC.net

This is an Australian online news/education portal that aims to provide the latest crypto news, real-time updates, education and reviews within Australia and around the world. Feel free to get in touch with us!

What's New Here!

XRP Wyckoff Pattern Maps Bullish Run To $3.70 This Summer

Surprising Link Between XRP And Crude Oil Revealed By Analyst

May 16, 2025
Crypto Trader Prints 517x Profit on Solana-Based Altcoin That’s Exploded 7,000% in Just One Week: Lookonchain

Crypto Trader Prints 517x Profit on Solana-Based Altcoin That’s Exploded 7,000% in Just One Week: Lookonchain

May 16, 2025

Subscribe Now

  • Contact Us
  • Privacy Policy
  • Terms of Use
  • DMCA

© 2021 cryptoabc.net - All rights reserved!

No Result
View All Result
  • Live Crypto Prices
  • Crypto News
    • Worldwide
      • Bitcoin
      • Ethereum
      • Altcoin
      • Blockchain
      • Regulation
    • Australian Crypto News
  • Education
    • Cryptocurrency For Beginners
    • Where to Buy Cryptocurrency
    • Where to Store Cryptos
    • Cryptocurrency Tax in Australia 2021

© 2021 cryptoabc.net - All rights reserved!

Welcome Back!

Login to your account below

Forgotten Password?

Create New Account!

Fill the forms below to register

All fields are required. Log In

Retrieve your password

Please enter your username or email address to reset your password.

Log In
  • Heart NumberHeart Number(HTN)$0.000000-30.47%
  • TadpoleTadpole(TAD)$0.000000-1.76%
  • SEENSEEN(SEEN)$0.000000-2.27%
  • EvedoEvedo(EVED)$0.000000-0.80%
  • MarginswapMarginswap(MFI)$0.000000-2.17%
  • SakeTokenSakeToken(SAKE)$0.0000004.37%
  • WTF TokenWTF Token(WTF)$0.0000000.16%
  • BNSD FinanceBNSD Finance(BNSD)$0.000000-5.83%
  • RobotinaRobotina(ROX)$0.00000038.50%
  • CageCage(C4G3)$0.000000-3.67%