


Solana started a fresh decline from the $155 zone. SOL price is now consolidating near $145 and might extend losses below the $142 support.
- SOL price started a fresh decline below the $150 and $148 levels against the US Dollar.
- The price is now trading below $150 and the 100-hourly simple moving average.
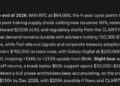
- There is a short-term rising channel or a continuation pattern forming with support at $144 on the hourly chart of the SOL/USD pair (data source from Kraken).
- The pair could start a fresh increase if it clears the $148 resistance zone.
Solana Price Consolidates Gains
Solana price formed a base above the $142 support and started a fresh increase, like Bitcoin and Ethereum. SOL gained pace for a move above the $145 and $150 resistance levels.
However, the bears were active below the $155 resistance zone. A high was formed at $153.90 and the price started a fresh decline. The price dipped below $150 and $148. A low was formed at $142.64 and the price is now consolidating losses.
There was a minor move above the 23.6% Fib retracement level of the downward move from the $153.90 swing high to the $142.64 low. Solana is now trading below $150 and the 100-hourly simple moving average. There is also a short-term rising channel or a continuation pattern forming with support at $144 on the hourly chart of the SOL/USD pair.
On the upside, the price is facing resistance near the $147 level. The next major resistance is near the $150 level and the 61.8% Fib retracement level of the downward move from the $153.90 swing high to the $142.64 low. The main resistance could be $155. A successful close above the $155 resistance zone could set the pace for another steady increase. The next key resistance is $165. Any more gains might send the price toward the $180 level.
More Losses in SOL?
If SOL fails to rise above the $150 resistance, it could start another decline. Initial support on the downside is near the $145 zone. The first major support is near the $142 level.
A break below the $142 level might send the price toward the $135 zone. If there is a close below the $135 support, the price could decline toward the $122 support in the near term.
Technical Indicators
Hourly MACD – The MACD for SOL/USD is gaining pace in the bearish zone.
Hourly Hours RSI (Relative Strength Index) – The RSI for SOL/USD is below the 50 level.
Major Support Levels – $145 and $142.
Major Resistance Levels – $147 and $150.
Credit: Source link


