


Reason to trust
Strict editorial policy that focuses on accuracy, relevance, and impartiality
Created by industry experts and meticulously reviewed
The highest standards in reporting and publishing
Strict editorial policy that focuses on accuracy, relevance, and impartiality
Morbi pretium leo et nisl aliquam mollis. Quisque arcu lorem, ultricies quis pellentesque nec, ullamcorper eu odio.
Este artículo también está disponible en español.
Solana is showing signs of strength as it pushes above a key resistance level, suggesting that bulls are beginning to regain some control after weeks of weakness. The broader crypto market remains volatile, driven by ongoing macroeconomic uncertainty and heightened trade tensions between the US and China. Despite these risks, investor sentiment appears to be improving slightly, fueling hopes that Solana and other altcoins could enter a recovery rally.
Related Reading
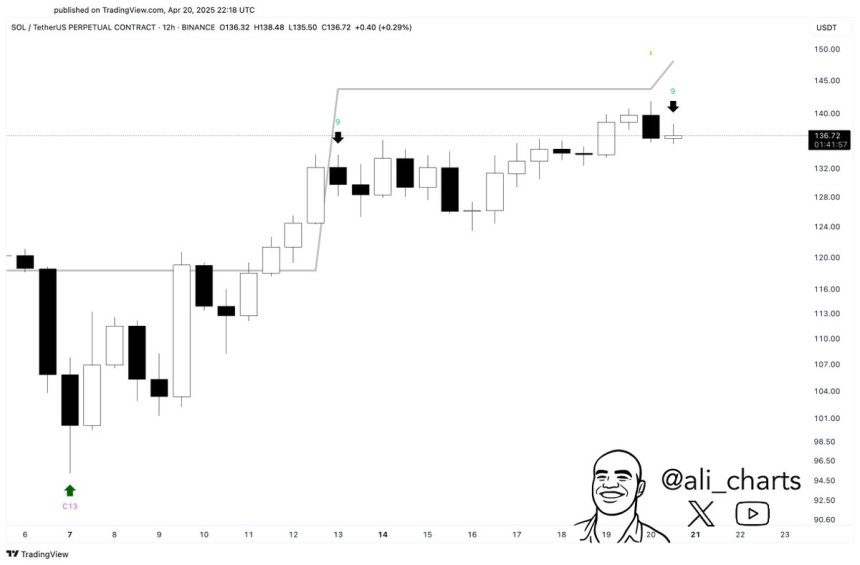
However, caution remains warranted. Top analyst Ali Martinez shared a technical signal that tempers the recent optimism—according to his analysis, Solana may be due for a short-term pullback. A sell signal has flashed on the 12-hour chart using the TD Sequential indicator, which has historically marked local tops and price exhaustion phases.
While Solana’s recent breakout is encouraging, the presence of this bearish signal suggests the rally may be losing steam in the near term. Investors will be watching closely to see whether SOL can hold support above the reclaimed levels or if it retreats under selling pressure. For now, the market is caught between early signs of recovery and the ever-present risk of another leg down.
Solana Faces Key Resistance As Short-Term Pullback Signal Emerges
Solana has surged over 48% since April 7, signaling renewed momentum after a prolonged period of intense selling pressure. Bulls are now facing a critical test as price approaches the $150 level—a key resistance zone that has held back further advances in the past.
Despite the recent recovery, Solana remains one of the most affected assets during the 2025 downtrend, having lost more than 65% of its value since its January peak. This underscores the significance of the current move and the importance of holding higher levels to confirm a true reversal.
Still, caution is warranted. Martinez shared data on X highlighting a TD Sequential sell signal on the 12-hour chart—a technical indicator that often precedes short-term trend exhaustion or reversals. The TD Sequential works by identifying a sequence of price movements that can indicate overbought or oversold conditions. If the signal plays out, Solana could face a temporary pullback before any sustained upside continues.
Macroeconomic factors remain in play, with ongoing trade tensions between the US and China still shaping sentiment across global markets. However, hopes for a potential agreement between the two countries and expanding global liquidity are giving bulls some optimism, especially within the altcoin sector.
Related Reading
SOL Price Hovers At Pivotal Zone: What’s Next?
Solana (SOL) is currently trading at critical levels, testing the key $150 resistance zone after a sharp recovery from recent lows. Bulls must reclaim and hold above this level to confirm a breakout and validate the start of a sustained uptrend. A decisive move above $150 would likely trigger further buying momentum, possibly leading to a retest of higher targets not seen since early March.
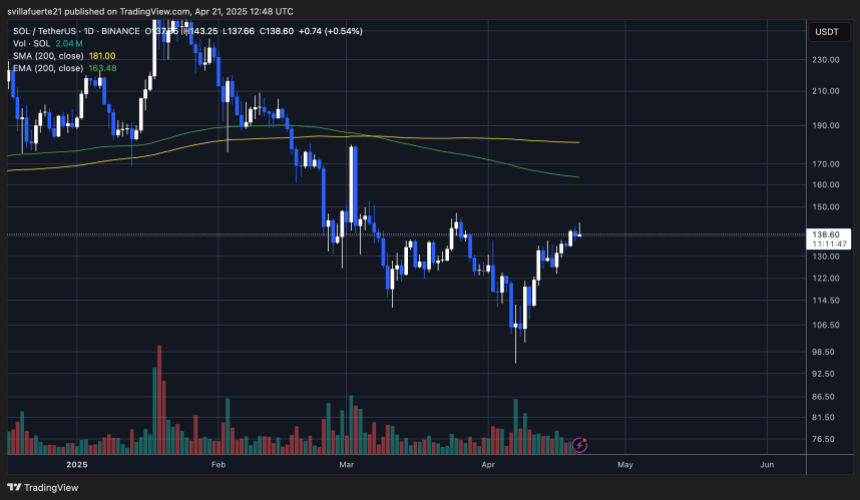
However, if SOL fails to break above this barrier in the short term, a period of consolidation between the $130 and $120 levels could still signal strength. Holding this zone would suggest that bulls are building a base for continued upward price action and absorbing selling pressure without a significant retrace. Such consolidation phases are often considered healthy in bullish market structures, allowing momentum to rebuild before the next leg higher.
Related Reading
On the downside, failure to hold the $120 support level could expose SOL to deeper losses, with the $100 zone as the next significant area of demand. A break below this level would invalidate the current bullish outlook and possibly reignite a broader downtrend. For now, all eyes are on SOL’s reaction around the $150 mark.
Featured image from Dall-E, chart from TradingView
Credit: Source link


