• Live Crypto Prices
  • Crypto News
    • Worldwide
      • Bitcoin
      • Ethereum
      • Altcoin
      • Blockchain
      • Regulation
    • Australian Crypto News
  • Education
    • Cryptocurrency For Beginners
    • Where to Buy Cryptocurrency
    • Where to Store Cryptos
    • Cryptocurrency Tax in Australia 2021
No Result
View All Result
CryptoABC.net
No Result
View All Result

Ethereum Forms Complex iH&S Structure, Why $18,000 Is The Possible Target

March 26, 2025
in Bitcoin
Reading Time: 4min read
0 0
A A
0
0
SHARES
2
VIEWS
ShareShareShareShareShare

Reason to trust

Strict editorial policy that focuses on accuracy, relevance, and impartiality

Created by industry experts and meticulously reviewed

The highest standards in reporting and publishing

Strict editorial policy that focuses on accuracy, relevance, and impartiality

Morbi pretium leo et nisl aliquam mollis. Quisque arcu lorem, ultricies quis pellentesque nec, ullamcorper eu odio.

Este artículo también está disponible en español.

Ethereum (ETH) is showing signs of a bullish breakout, forming a complex Inverse Head and Shoulder (iH&S) pattern on the weekly timeframe. This key technical formation suggests that the Ethereum price is on track for a massive rally toward a bullish target of $18,000. 

Ethereum Forms Inverse Head & Shoulder Pattern

The Ethereum price has been in a long consolidation period, experiencing a crash amid the ongoing market turmoil. Despite recording massive declines that have pushed its value significantly below all-time highs, crypto analyst Gert van Lagen on X (formerly Twitter) predicts that ETH could still reach a price target of $18,000.

Related Reading

Notably, Ethereum recently bounced off the $1,800 – $2,000 support range, which previously served as resistance during the ‘Head’ phase of the iH&S pattern. With this crucial retest confirmed, ETH may be entering the final stage of its reversal, set up to new all-time highs. 

Lagen’s $18,000 bullish target is more than 8X Ethereum’s current price, underscoring the sheer magnitude of this projection. Lagen has identified the formation of the iH&S structure on the Ethereum chart, supporting his ambitious prediction with this renowned bullish chart pattern. 

Ethereum
Source: Gert Van Lagen on X

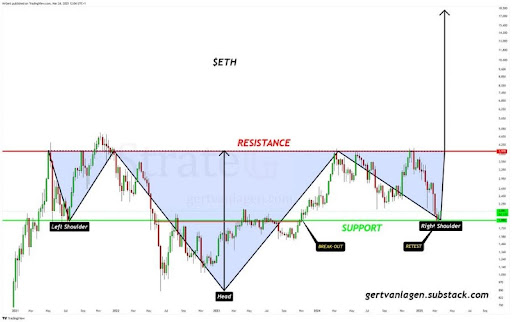
The Inverse Head and Shoulder is a classic bullish reversal structure, often signaling the end of a downtrend and the beginning of a strong and new uptrend. Considering the Ethereum’s price has been in a downturn, the formation of the iH&S chart pattern suggests that this prolonged decline may be finally coming to an end.

In the analyst’s chart, this left shoulder of the iH&S structure began forming from 2021 to 2022, experiencing a price peak before a pullback. From 2022 to 2023, a deeper decline occurred, marking the cycle low and the formation of the ‘Head.’ Finally, the right shoulder of the technical pattern was formed between 2024 to 2024, recording a higher low that aligned with the left shoulder.

Lagen’s price chart highlights that the most critical level to watch is the neckline of the iH&S structure, which is approximately $3,978 and acts as the primary resistance area.

How An $18,000 ETH Target Is Possible

Still looking at Lagen’s Ethereum price chart, the analyst suggests that if ETH can surpass the $3,978 resistance level with strong volume, it could validate the Inverse Head and Shoulder pattern and open the door for a rally toward $18,000. Conversely, if Ethereum fails to break above this resistance level, a prolonged consolidation or significant pullback may occur before its next breakout attempt. 

Related Reading

Lagen predicts that a rejection at the resistance area could see the Ethereum price drop to $1,888 — an important support level which could prevent further declines. A drop to this support would represent a potential 52% dip from the main resistance level and an 8.52% decline from ETH’s current market value of $2,055.

Ethereum
ETH trading at $2,072 on the 1D chart | Source: ETHUSDT on Tradingview.com

Featured image from Unsplash, chart from Tradingview.com

Credit: Source link

ShareTweetSendPinShare
Previous Post

Bitcoin Breaks Daily RSI Downtrend, But Analyst Warns Of Strong Resistance Ahead

Next Post

Fidelity Makes Bold Move into Solana Ecosystem, Files Official ETF Application with SEC

Next Post
Fidelity Makes Bold Move into Solana Ecosystem, Files Official ETF Application with SEC

Fidelity Makes Bold Move into Solana Ecosystem, Files Official ETF Application with SEC

You might also like

AAVE Price Prediction: Testing $240 Breakout with $280 Medium-Term Target Despite Bearish Momentum

AAVE Price Prediction: Technical Recovery Targets $125-$140 by April 2026

March 9, 2026
Culper Shorts Ethereum, Says Buterin Selling Signals More Pain

Culper Shorts Ethereum, Says Buterin Selling Signals More Pain

March 6, 2026
OKX Says Australia Could Unlock $24B Digital Finance Boom With Faster Crypto Rules

OKX Says Australia Could Unlock $24B Digital Finance Boom With Faster Crypto Rules

March 5, 2026
BitGo Expands Crypto-as-a-Service Across Europe Under MiCAR Framework

BitGo Expands Crypto-as-a-Service Across Europe Under MiCAR Framework

March 4, 2026
Solana Price Prediction: Western Union Just Chose Solana for Its New Stablecoin — Is SOL About to Explode?

Solana Price Prediction: Western Union Just Chose Solana for Its New Stablecoin — Is SOL About to Explode?

March 5, 2026
Jamie Dimon Warns Stablecoin Yield Fight Could Threaten US Financial System

Jamie Dimon Warns Stablecoin Yield Fight Could Threaten US Financial System

March 4, 2026
CryptoABC.net

This is an Australian online news/education portal that aims to provide the latest crypto news, real-time updates, education and reviews within Australia and around the world. Feel free to get in touch with us!

What's New Here!

Bitcoin Price Prediction: Florida’s Crypto Bill and $198B U.S. Surplus Boost Market Outlook

Bitcoin Price Prediction: Oil Just Exploded 20% — Is BTC About to Crash?

March 10, 2026
LTC Price Prediction: Targeting $87-$95 Range as Technical Indicators Signal Further Decline Through November 2025

LTC Price Prediction: Targets $62-65 by April 2026 as Technical Indicators Signal Neutral Momentum

March 10, 2026

Subscribe Now

  • Contact Us
  • Privacy Policy
  • Terms of Use
  • DMCA

© 2021 cryptoabc.net - All rights reserved!

No Result
View All Result
  • Live Crypto Prices
  • Crypto News
    • Worldwide
      • Bitcoin
      • Ethereum
      • Altcoin
      • Blockchain
      • Regulation
    • Australian Crypto News
  • Education
    • Cryptocurrency For Beginners
    • Where to Buy Cryptocurrency
    • Where to Store Cryptos
    • Cryptocurrency Tax in Australia 2021

© 2021 cryptoabc.net - All rights reserved!

Welcome Back!

Login to your account below

Forgotten Password?

Create New Account!

Fill the forms below to register

All fields are required. Log In

Retrieve your password

Please enter your username or email address to reset your password.

Log In
Please enter CoinGecko Free Api Key to get this plugin works.