• Live Crypto Prices
  • Crypto News
    • Worldwide
      • Bitcoin
      • Ethereum
      • Altcoin
      • Blockchain
      • Regulation
    • Australian Crypto News
  • Education
    • Cryptocurrency For Beginners
    • Where to Buy Cryptocurrency
    • Where to Store Cryptos
    • Cryptocurrency Tax in Australia 2021
No Result
View All Result
CryptoABC.net
No Result
View All Result

Head, Shoulders Pattern Predicts Crash- Here’s The Target

March 9, 2025
in Bitcoin
Reading Time: 4min read
0 0
A A
0
Head, Shoulders Pattern Predicts Crash- Here’s The Target
0
SHARES
10
VIEWS
ShareShareShareShareShare

Reason to trust

Strict editorial policy that focuses on accuracy, relevance, and impartiality

Created by industry experts and meticulously reviewed

The highest standards in reporting and publishing

Strict editorial policy that focuses on accuracy, relevance, and impartiality

Morbi pretium leo et nisl aliquam mollis. Quisque arcu lorem, ultricies quis pellentesque nec, ullamcorper eu odio.

Este artículo también está disponible en español.

Tony Severino, a prominent crypto analyst, has shared a new Bitcoin price forecast, suggesting that the pioneer cryptocurrency is on the verge of another major correction. The analyst suggested that the formation of a Lower Time Frame (LTF) Head and Shoulders pattern on the Bitcoin price chart is a potential confirmation of a crash to mid-$80,000. 

Bitcoin Price Projected To Crash To $83,600

The market’s recent downturn has negatively impacted Bitcoin’s value, prompting less-than-favorable predictions from top analysts. Severino posted on X (formerly Twitter) on March 6 that Bitcoin could soon experience another major pullback to new lows.

Related Reading

The analyst projected that Bitcoin could crash to $84,800 – $83,600. This bearish price outlook is supported by the recent formation of LTF Head and Shoulder pattern on the Bitcoin chart. 

A Head and Shoulder pattern is a technical analysis formation that usually indicates a potential reversal from bullish to bearish. It appears as three peaks on a price chart, with the middle peak, which is the head, being higher than the others (the shoulders). Notably, the Head and Shoulder pattern is considered one of the most recognizable patterns for projecting a downtrend in a cryptocurrency.

In the case of Bitcoin, Severino’s chart illustrates a symmetrical triangle with an internal A-B-C-D-E wave-like structure. The black diagonal lines in the chart form the symmetrical triangle, which indicates lower highs and higher lows. Inside the triangle, red lines form the waves, suggesting that the Bitcoin price may be chopping sideways but with a bias towards completing the triangle.

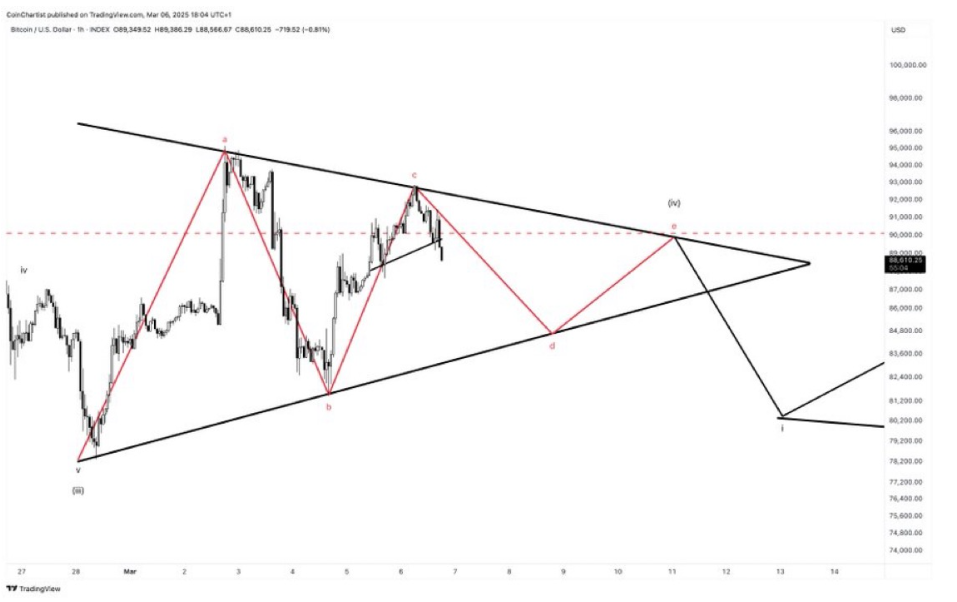
Due to the Head and Shoulder pattern formation, Bitcoin could see its price break down to the lower boundary of the triangle around the mid $80,000 region. This price crash would complete the D wave and possibly test the next critical support area. 

Once Bitcoin drops to this level, Severino predicts that it could bounce back to new highs. The chart shows that Bitcoin could rally toward the E wave in the triangle, which is positioned around the $90,000 price level. 

BTC is now trading at $86,315. Chart: TradingView

Furthermore, the analyst’s Bitcoin chart indicates another deeper pullback after this price rebound to $90,000. Toward the right side of the chart, an arrow points downwards, suggesting that after the final E wave rally, Bitcoin could drop down towards $83,600 to $80,200. 

Analyst Warns Of Bear Trap Before Bull Run Finale

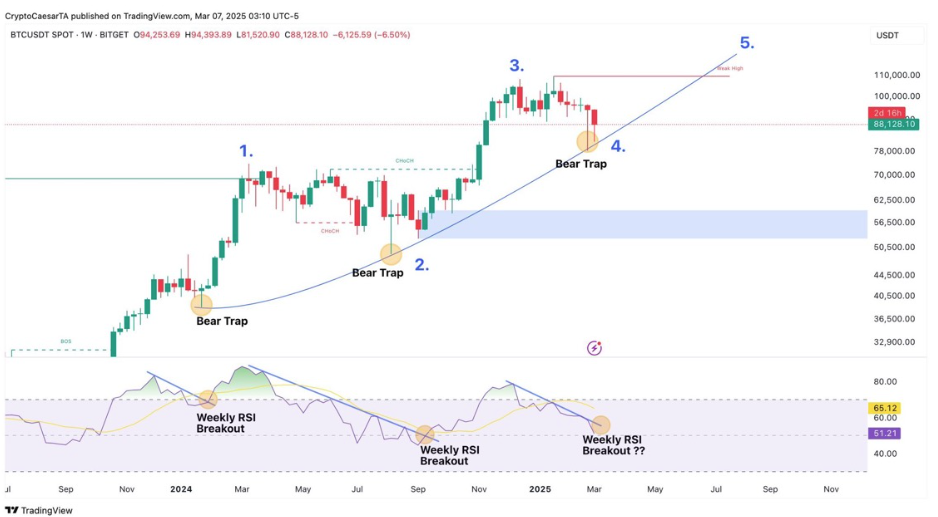
While many in the crypto market label this massive decline in the Bitcoin price as the beginning of the bear market, others believe that this price crash could be a mere bear trap. A market expert known as ’Crypto Caesar’ predicted that Bitcoin would be on the verge of its final bear trap before entering the last phase of this bull cycle. 

Related Reading

This implies that Bitcoin is likely to face another sharp decline, shaking out weak hands before surging to a new all-time high. The analyst’s chart predicts that it could top out above $110,000, signaling the end of the bull market. 

Featured image from Pexels, chart from TradingView

Credit: Source link

ShareTweetSendPinShare
Previous Post

Bitcoin’s odds of June highs, SOL’s $485M outflows, and more: Hodler’s Digest, March 2 – 8

Next Post

Growth of One of the ‘Most Anticipated’ AI Token Launches in 2025 on Track: IntoTheBlock

Next Post
Growth of One of the ‘Most Anticipated’ AI Token Launches in 2025 on Track: IntoTheBlock

Growth of One of the ‘Most Anticipated’ AI Token Launches in 2025 on Track: IntoTheBlock

You might also like

Bitcoin Probes $73,000 Liquidity Pocket: Is The Next Leg Toward $80,000 Loading?

Bitcoin Probes $73,000 Liquidity Pocket: Is The Next Leg Toward $80,000 Loading?

March 15, 2026
Ethereum Price Sinks To $2,800, Raising Fresh Downside Fears

Ethereum Price Struggles Near Highs — Reversal Risk Rising

March 12, 2026
Pepe Price Prediction: PEPE Price Dumped 30% in October, But Analyst Points to a Reversal Coming Soon – Is PEPE Going to the Moon This Week?

Bitcoin Decouples from Sinking FTSE 100 as Gilt Yields Surge

March 9, 2026
Uniswap (UNI) Price Rallies 6.53% – Is Now the Time to Buy? Comprehensive Analysis & Trading Insights

WIF Price Prediction: Dogwifhat Eyes $0.21 Recovery After Testing Key Support

March 14, 2026
Bitcoin ETFs Break 5-Month Streak With 2nd Consecutive Week Of Inflows

Bitcoin ETFs Break 5-Month Streak With 2nd Consecutive Week Of Inflows

March 8, 2026
Crypto Lender BlockFills Faces Restructuring, Lawsuit After Losses and Accounting Issues

Crypto Lender BlockFills Faces Restructuring, Lawsuit After Losses and Accounting Issues

March 9, 2026
CryptoABC.net

This is an Australian online news/education portal that aims to provide the latest crypto news, real-time updates, education and reviews within Australia and around the world. Feel free to get in touch with us!

What's New Here!

On-Chain Data Shows Why Bitcoin’s Next Stop Could Be At $82K

On-Chain Data Shows Why Bitcoin’s Next Stop Could Be At $82K

March 15, 2026
Bitcoin Probes $73,000 Liquidity Pocket: Is The Next Leg Toward $80,000 Loading?

Bitcoin Probes $73,000 Liquidity Pocket: Is The Next Leg Toward $80,000 Loading?

March 15, 2026

Subscribe Now

  • Contact Us
  • Privacy Policy
  • Terms of Use
  • DMCA

© 2021 cryptoabc.net - All rights reserved!

No Result
View All Result
  • Live Crypto Prices
  • Crypto News
    • Worldwide
      • Bitcoin
      • Ethereum
      • Altcoin
      • Blockchain
      • Regulation
    • Australian Crypto News
  • Education
    • Cryptocurrency For Beginners
    • Where to Buy Cryptocurrency
    • Where to Store Cryptos
    • Cryptocurrency Tax in Australia 2021

© 2021 cryptoabc.net - All rights reserved!

Welcome Back!

Login to your account below

Forgotten Password?

Create New Account!

Fill the forms below to register

All fields are required. Log In

Retrieve your password

Please enter your username or email address to reset your password.

Log In
Please enter CoinGecko Free Api Key to get this plugin works.