Este artículo también está disponible en español.
In the aftermath of yesterday’s Bitcoin crash, market participants are closely examining whether the leading cryptocurrency by market capitalization can rebound or if it faces the prospect of another decline. In a post shared on X today, February 4, on-chain analysis data provider Lookonchain offered insights into five critical indicators that may help traders and investors assess Bitcoin’s current position.
“The price of Bitcoin experienced a major crash yesterday! Will it continue to rise or fall from the top? Let’s use 5 indicators to see if BTC is at its peak now,” Lookonchain writes.
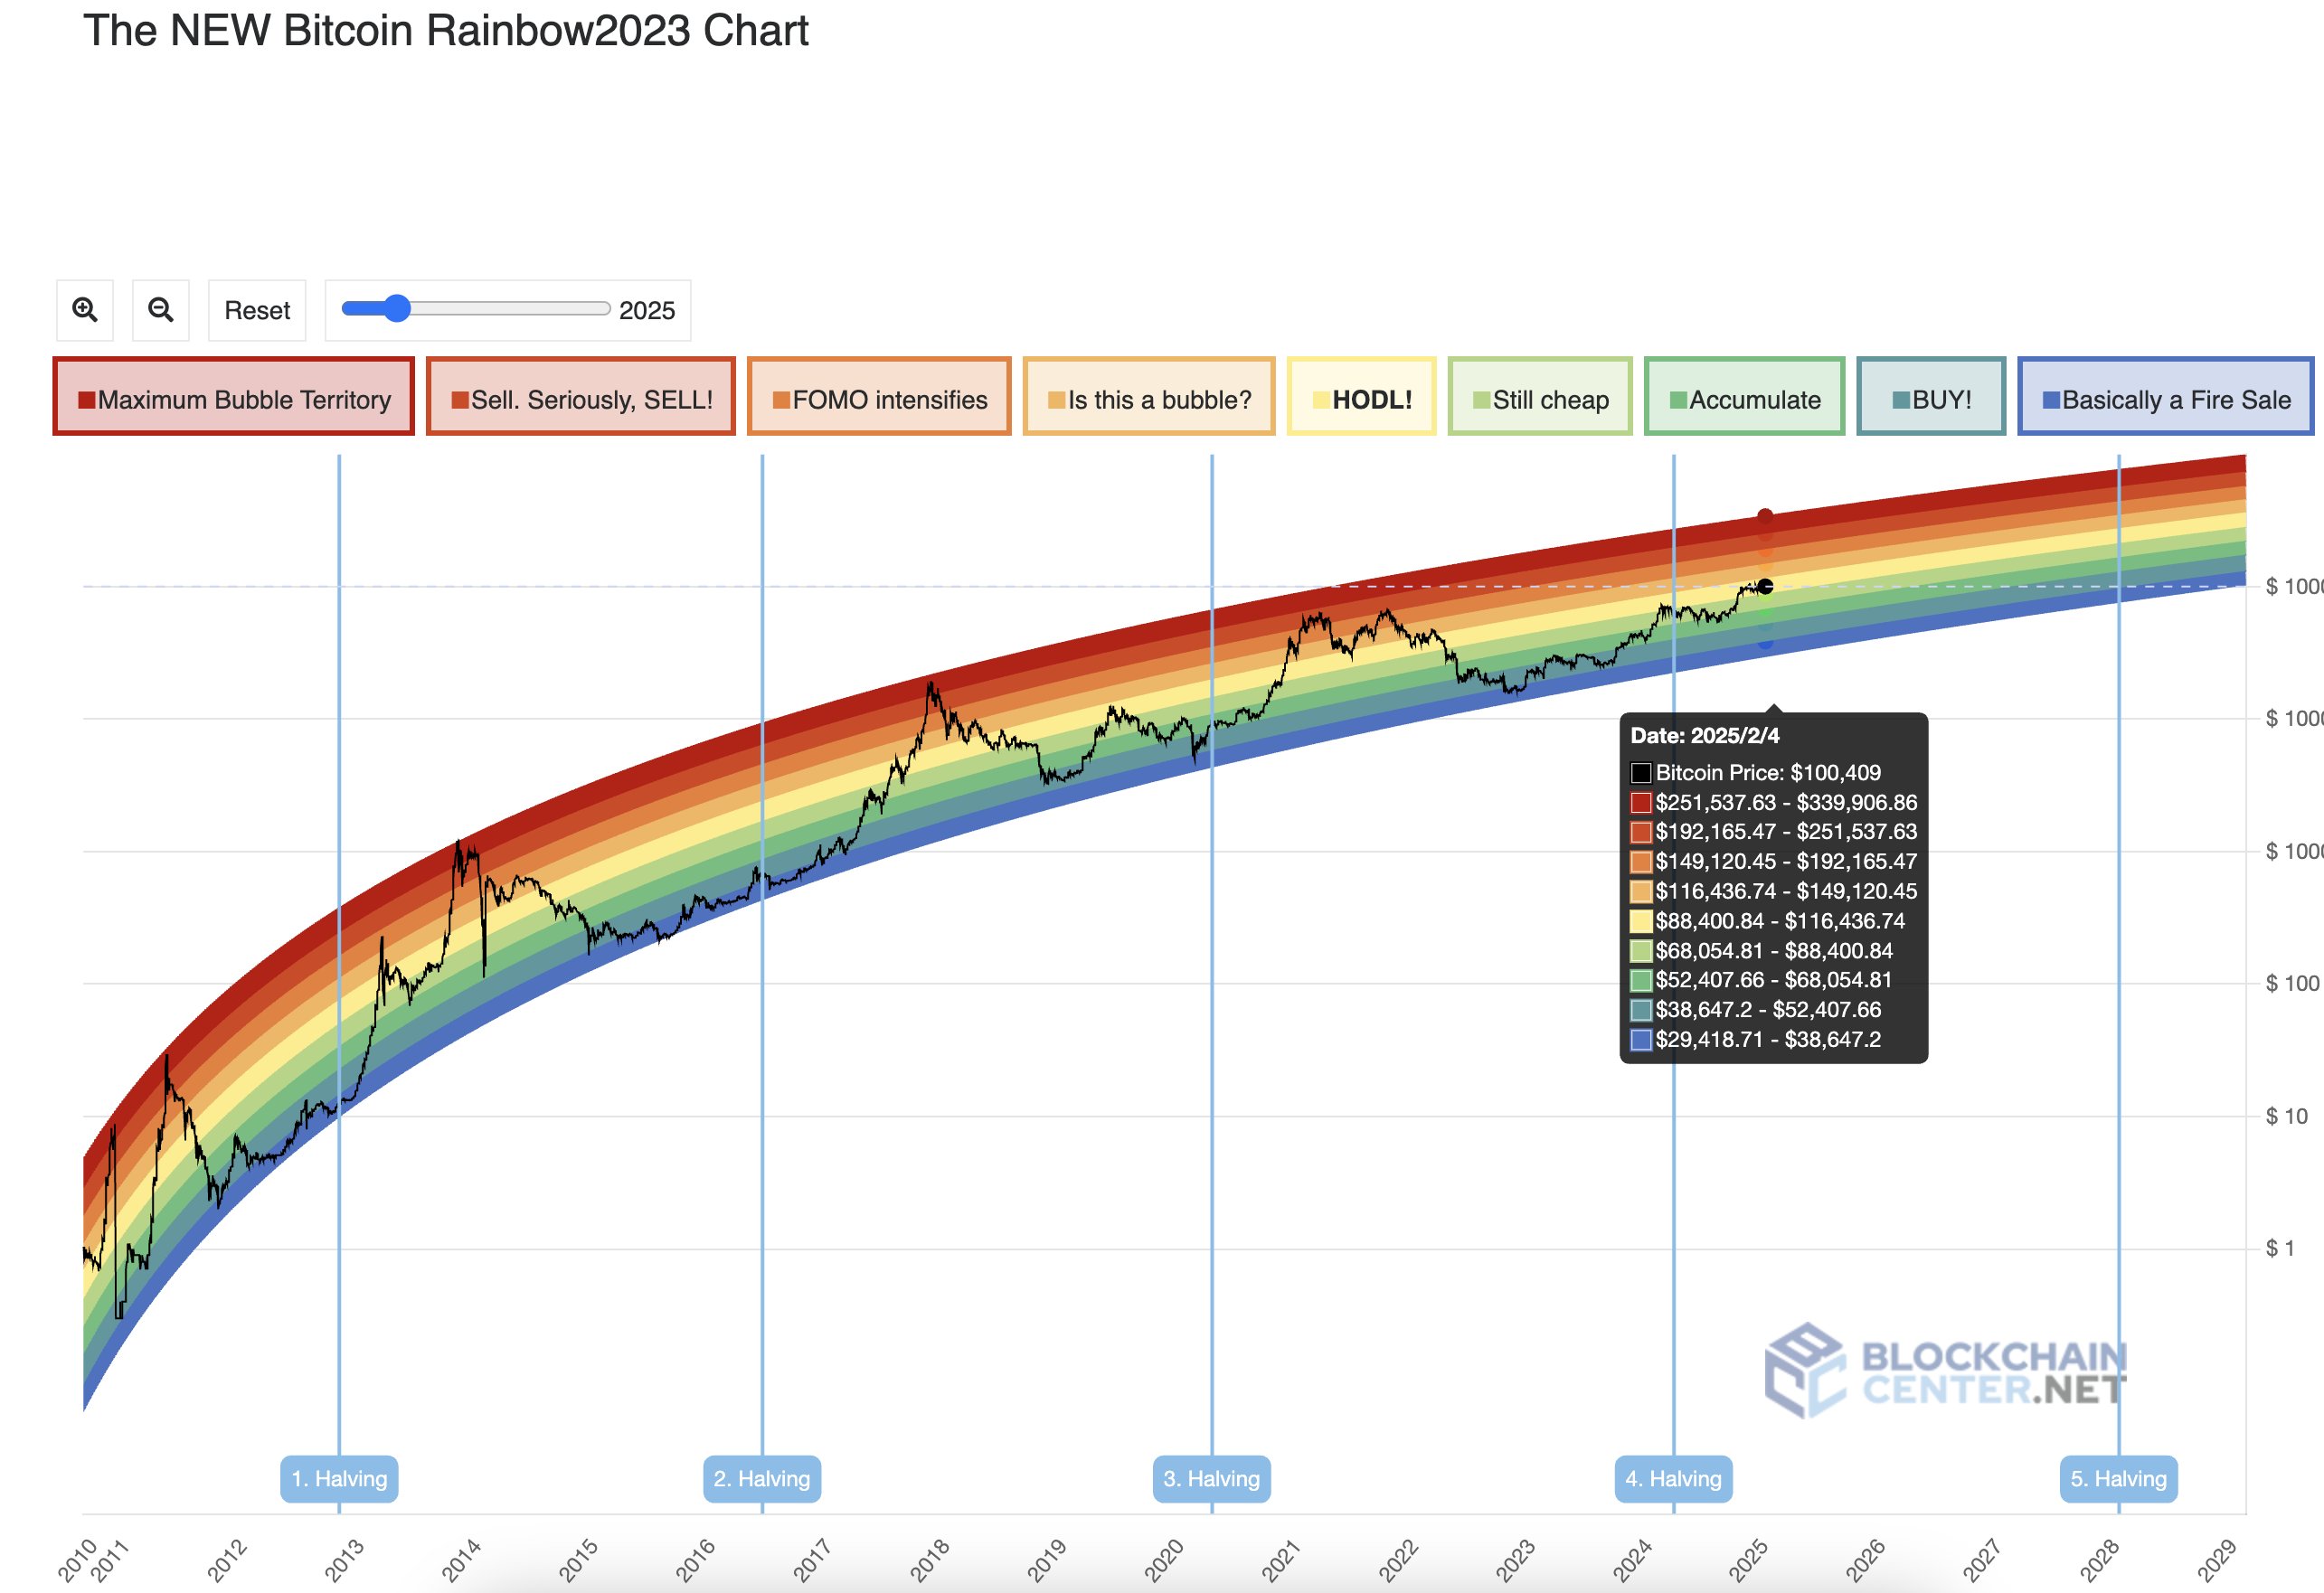
#1 Bitcoin Rainbow Chart
Described by Lookonchain as “a long-term valuation tool that uses a logarithmic growth curve to forecast the potential future price direction of BTC,” the Rainbow Chart is often employed to gauge whether Bitcoin might be undervalued, overvalued, or approaching a key turning point. “The NEW Bitcoin Rainbow2023 Chart shows that you can still hold BTC, and BTC will top above $250K this cycle.”
Related Reading
While this chart suggests a bullish long-term trajectory, its forecasts are based on historical price patterns and may not account for unforeseen market events. Nonetheless, Lookonchain’s data indicates a view that Bitcoin has yet to reach its cycle peak.
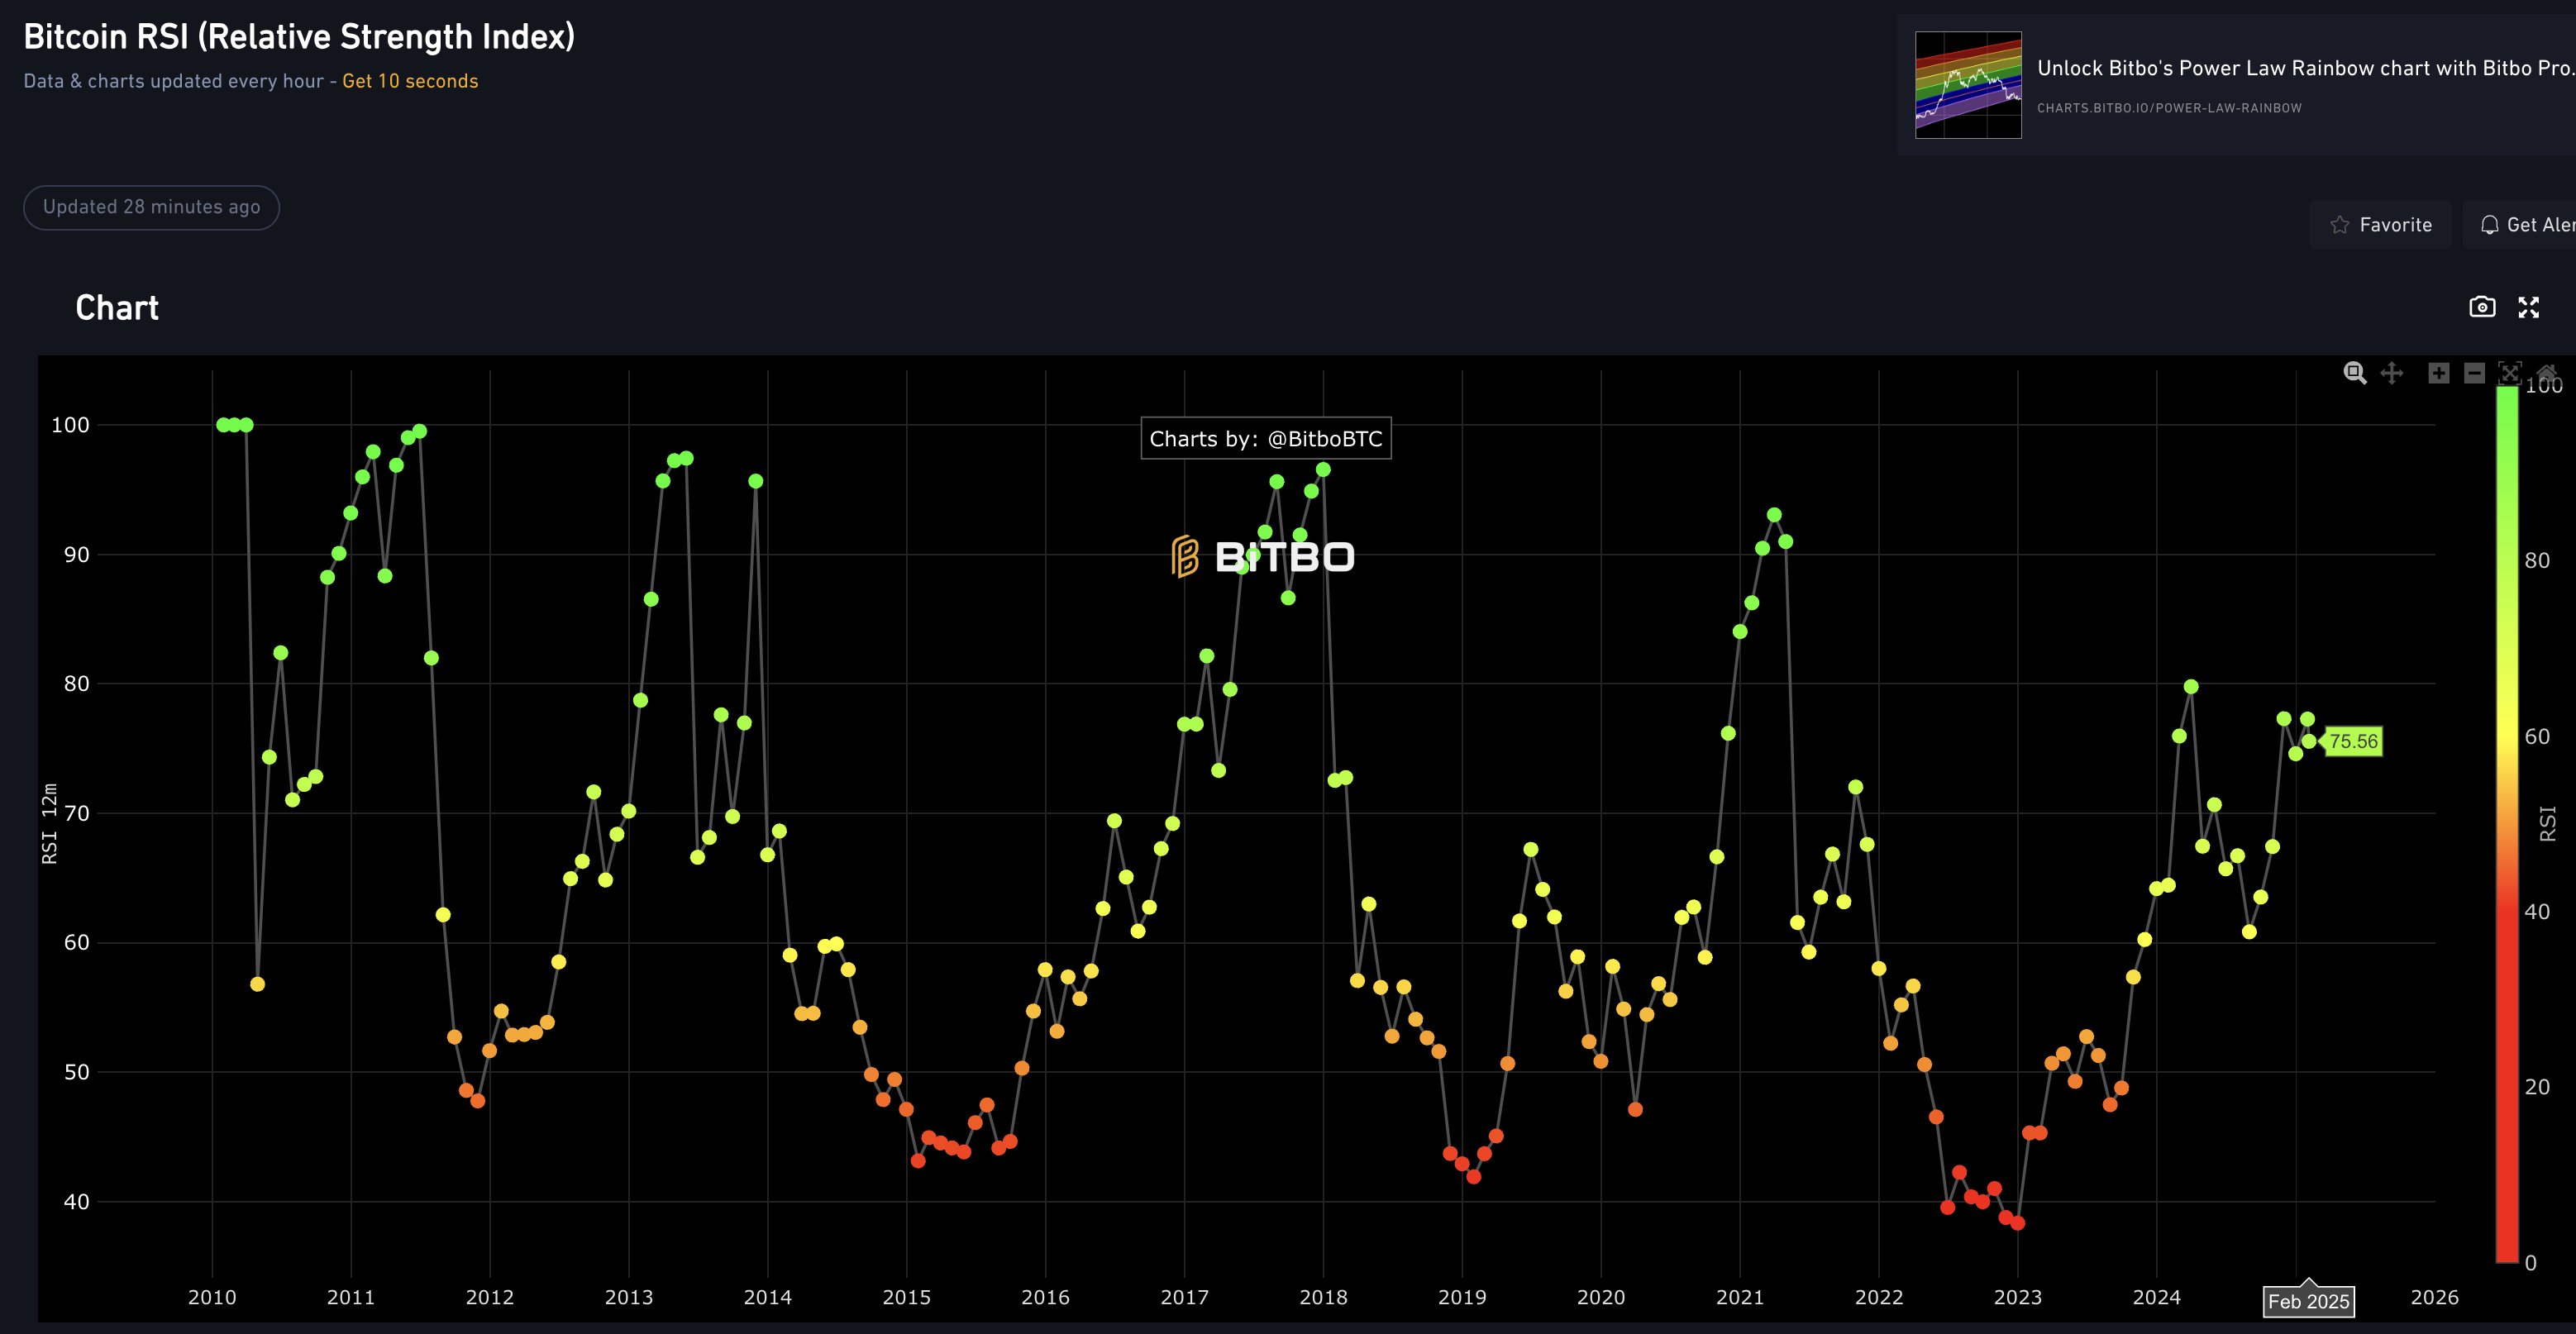
#2 Relative Strength Index (RSI)
The RSI is a technical indicator measuring the magnitude of recent price changes to evaluate overbought or oversold conditions.“≥ 70: BTC is overbought and may soon fall. ≤ 30: BTC is oversold and may soon increase. The current RSI is 75.56, compared with previous data, it seems that BTC has not yet reached its peak.”
An RSI reading above 70 typically raises concerns that a correction may be due. However, Lookonchain’s observation underscores their view that despite the high RSI, historical data does not necessarily confirm a definitive market top.
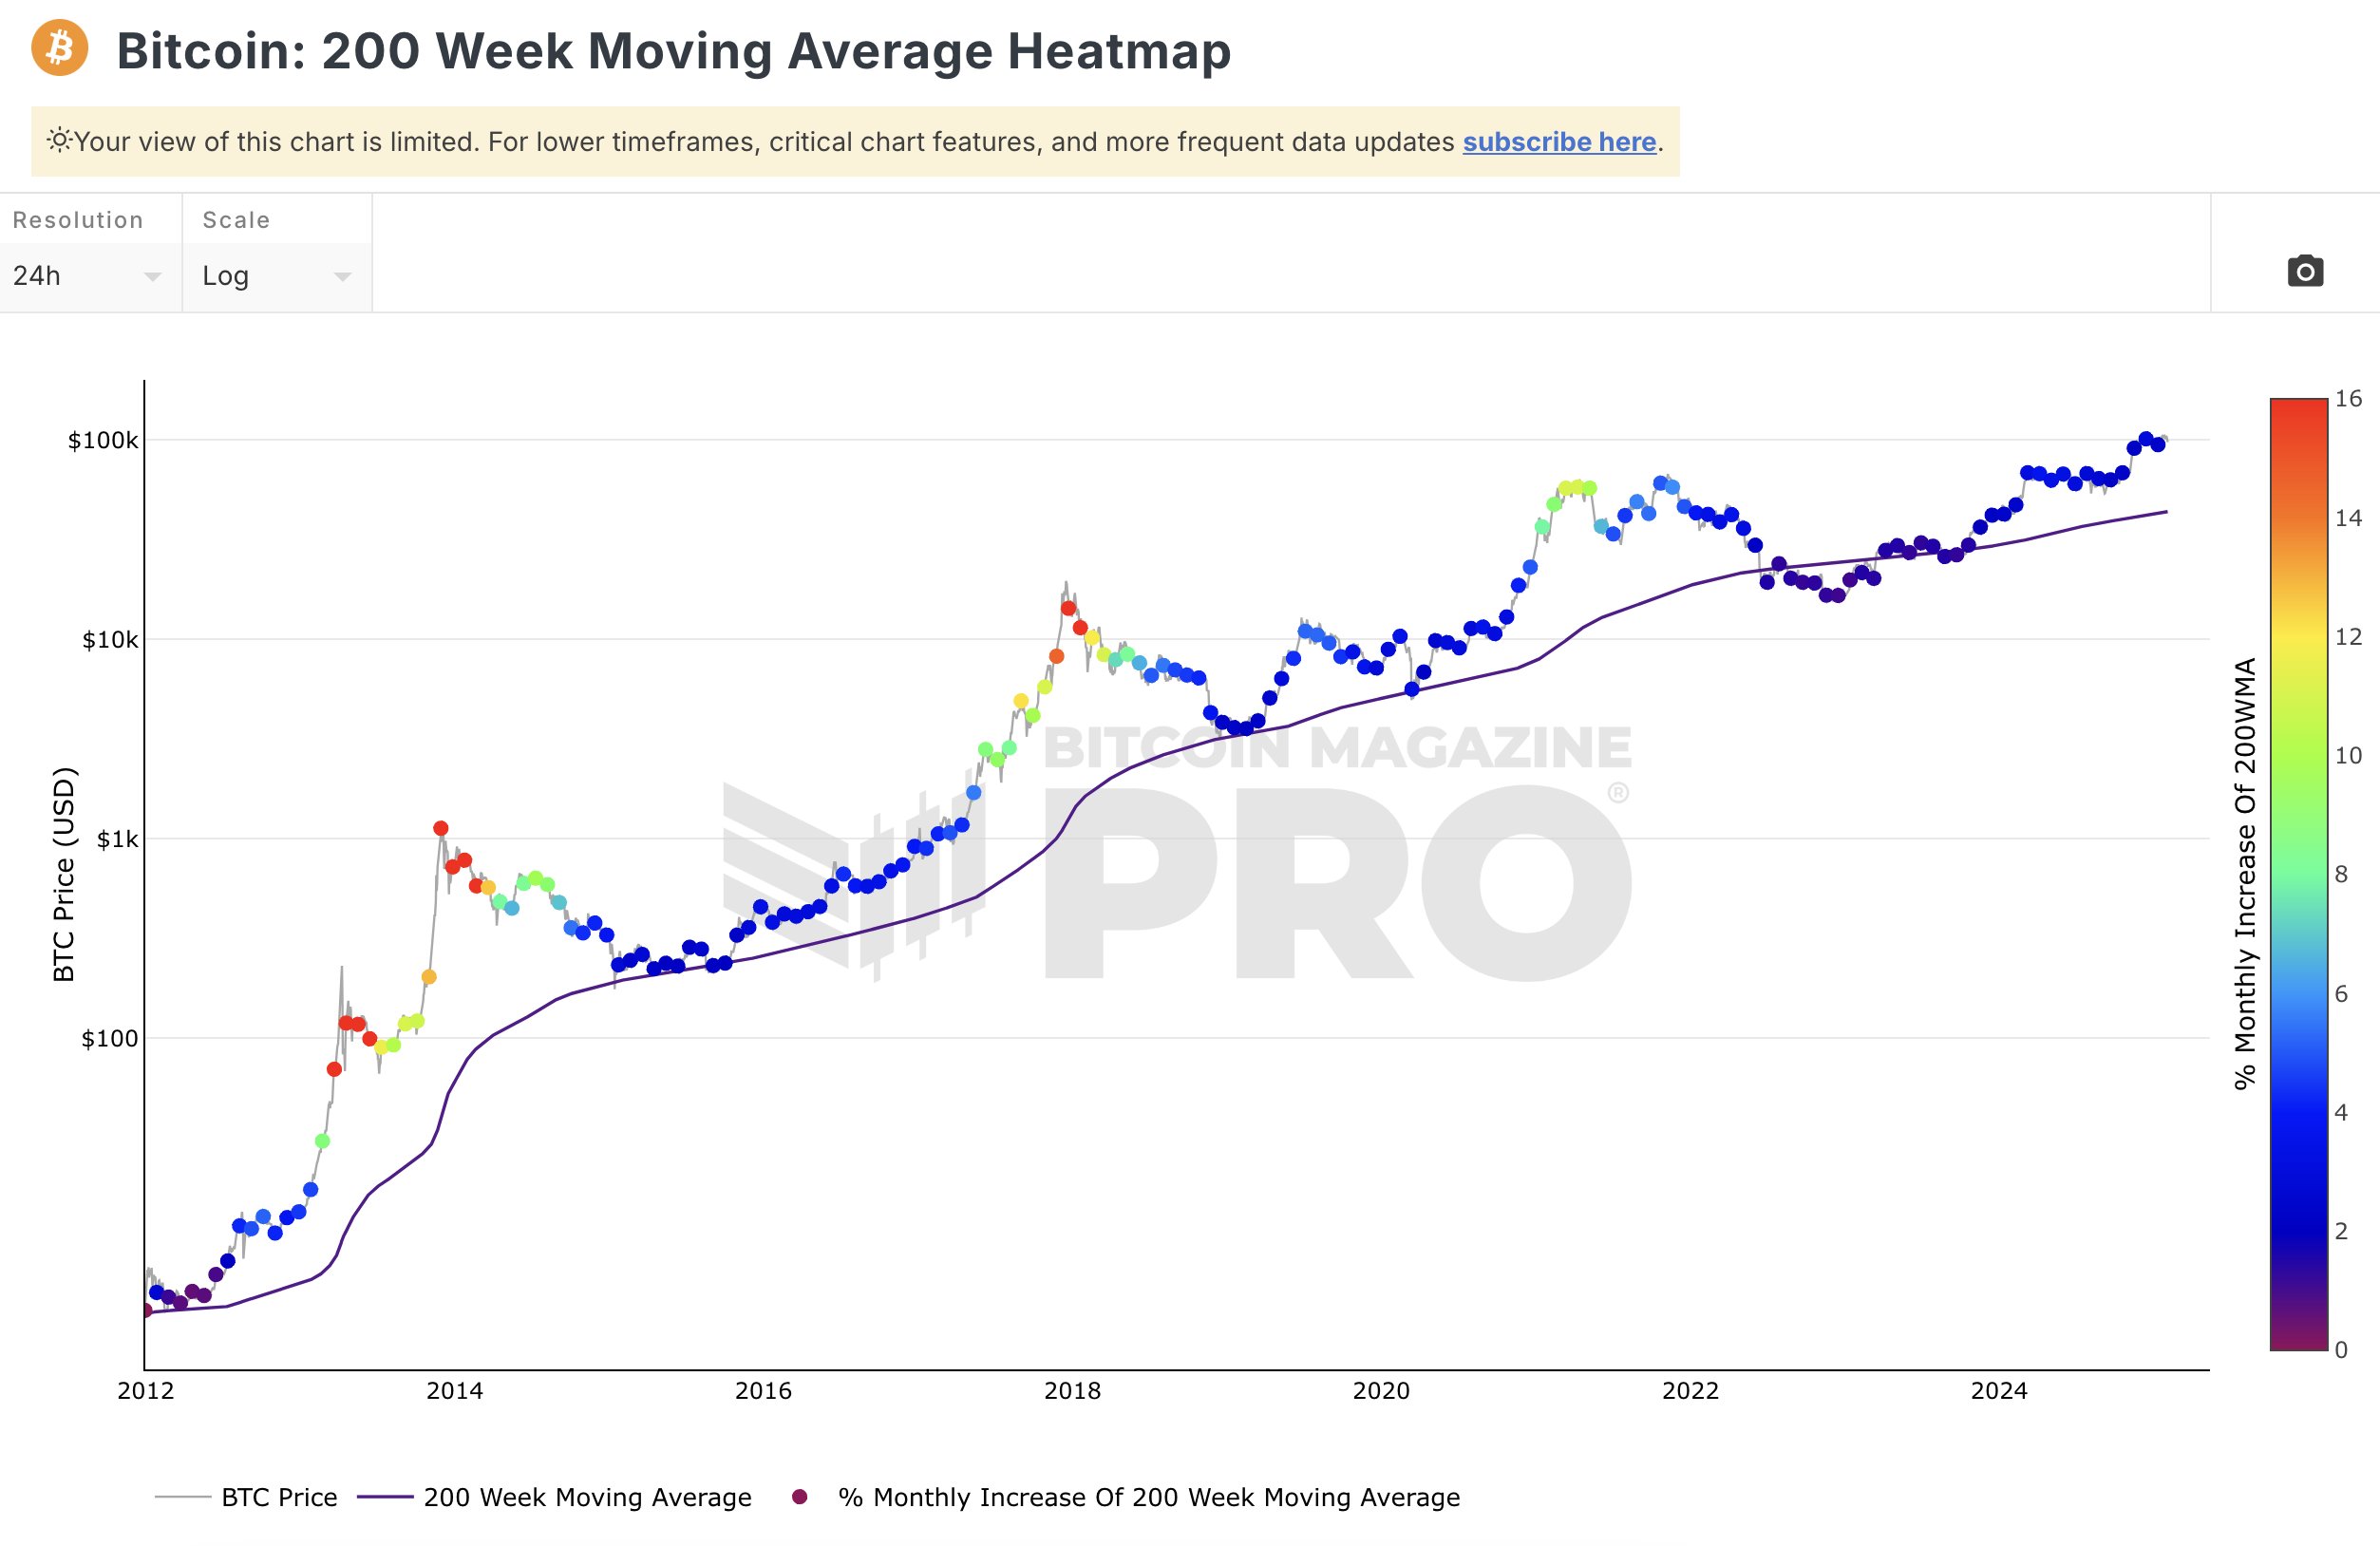
#3 200 Week Moving Average (200W MA) Heatmap
Traders often reference the 200W MA as a foundational support or resistance level. Its heatmap variation charts the broader momentum and potential inflection points over a multi-year period. “The 200 Week Moving Average Heatmap shows that the current price point is blue, which means that the price top has not been reached yet, and it is time to hold and buy.”
Related Reading
A “blue” reading on the heatmap implies the market has not displayed the peak signals observed in prior cycles. While some might view this as indicative of further potential upside, others remain cautious given macroeconomic uncertainties.
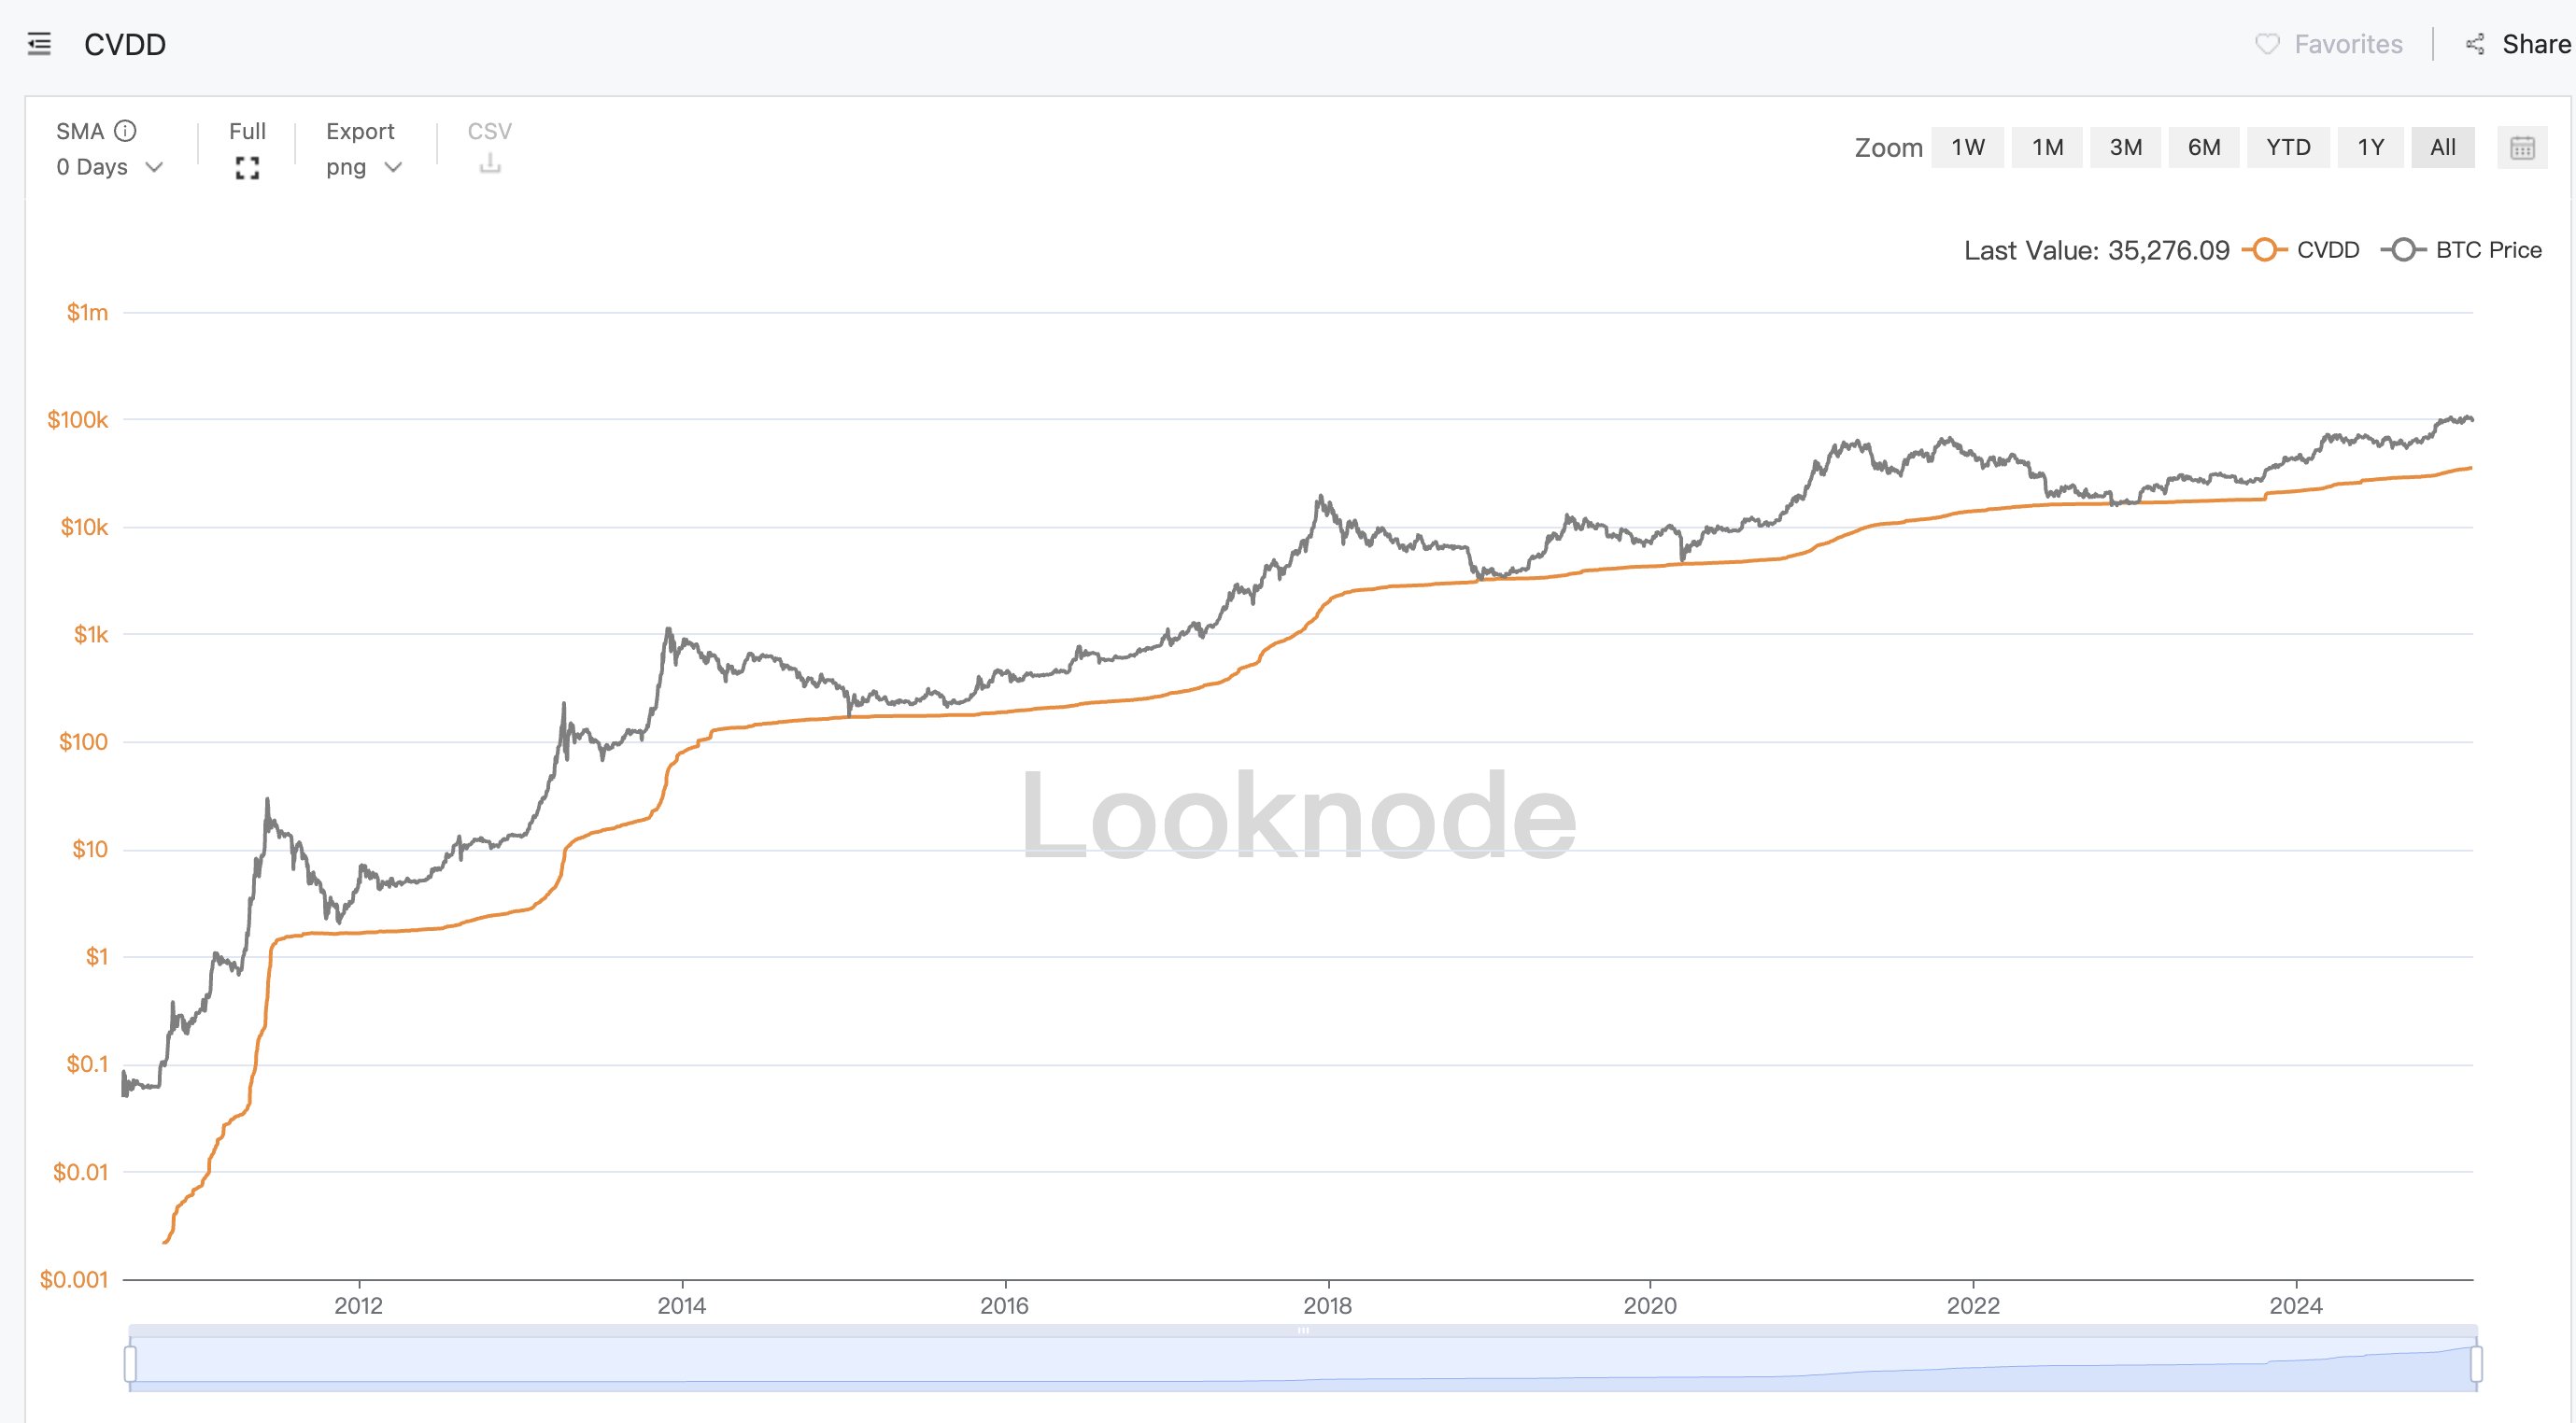
#4 Bitcoin Cumulative Value Coin Days Destroyed (CVDD)
Coin Days Destroyed is a long-standing on-chain metric that focuses on how long BTC has remained in a particular wallet before being moved. CVDD aggregates this data over time, aiming to pinpoint points where Bitcoin might be undervalued or overvalued. “When the BTC price touches the green line, the $BTC price is undervalued and it is a good buying opportunity. The current CVDD shows that the top of $BTC does not seem to have been reached yet.”
According to Lookonchain, Bitcoin’s position relative to this metric implies that the market has not encountered the historically observed top conditions, suggesting the possibility of further upward momentum.
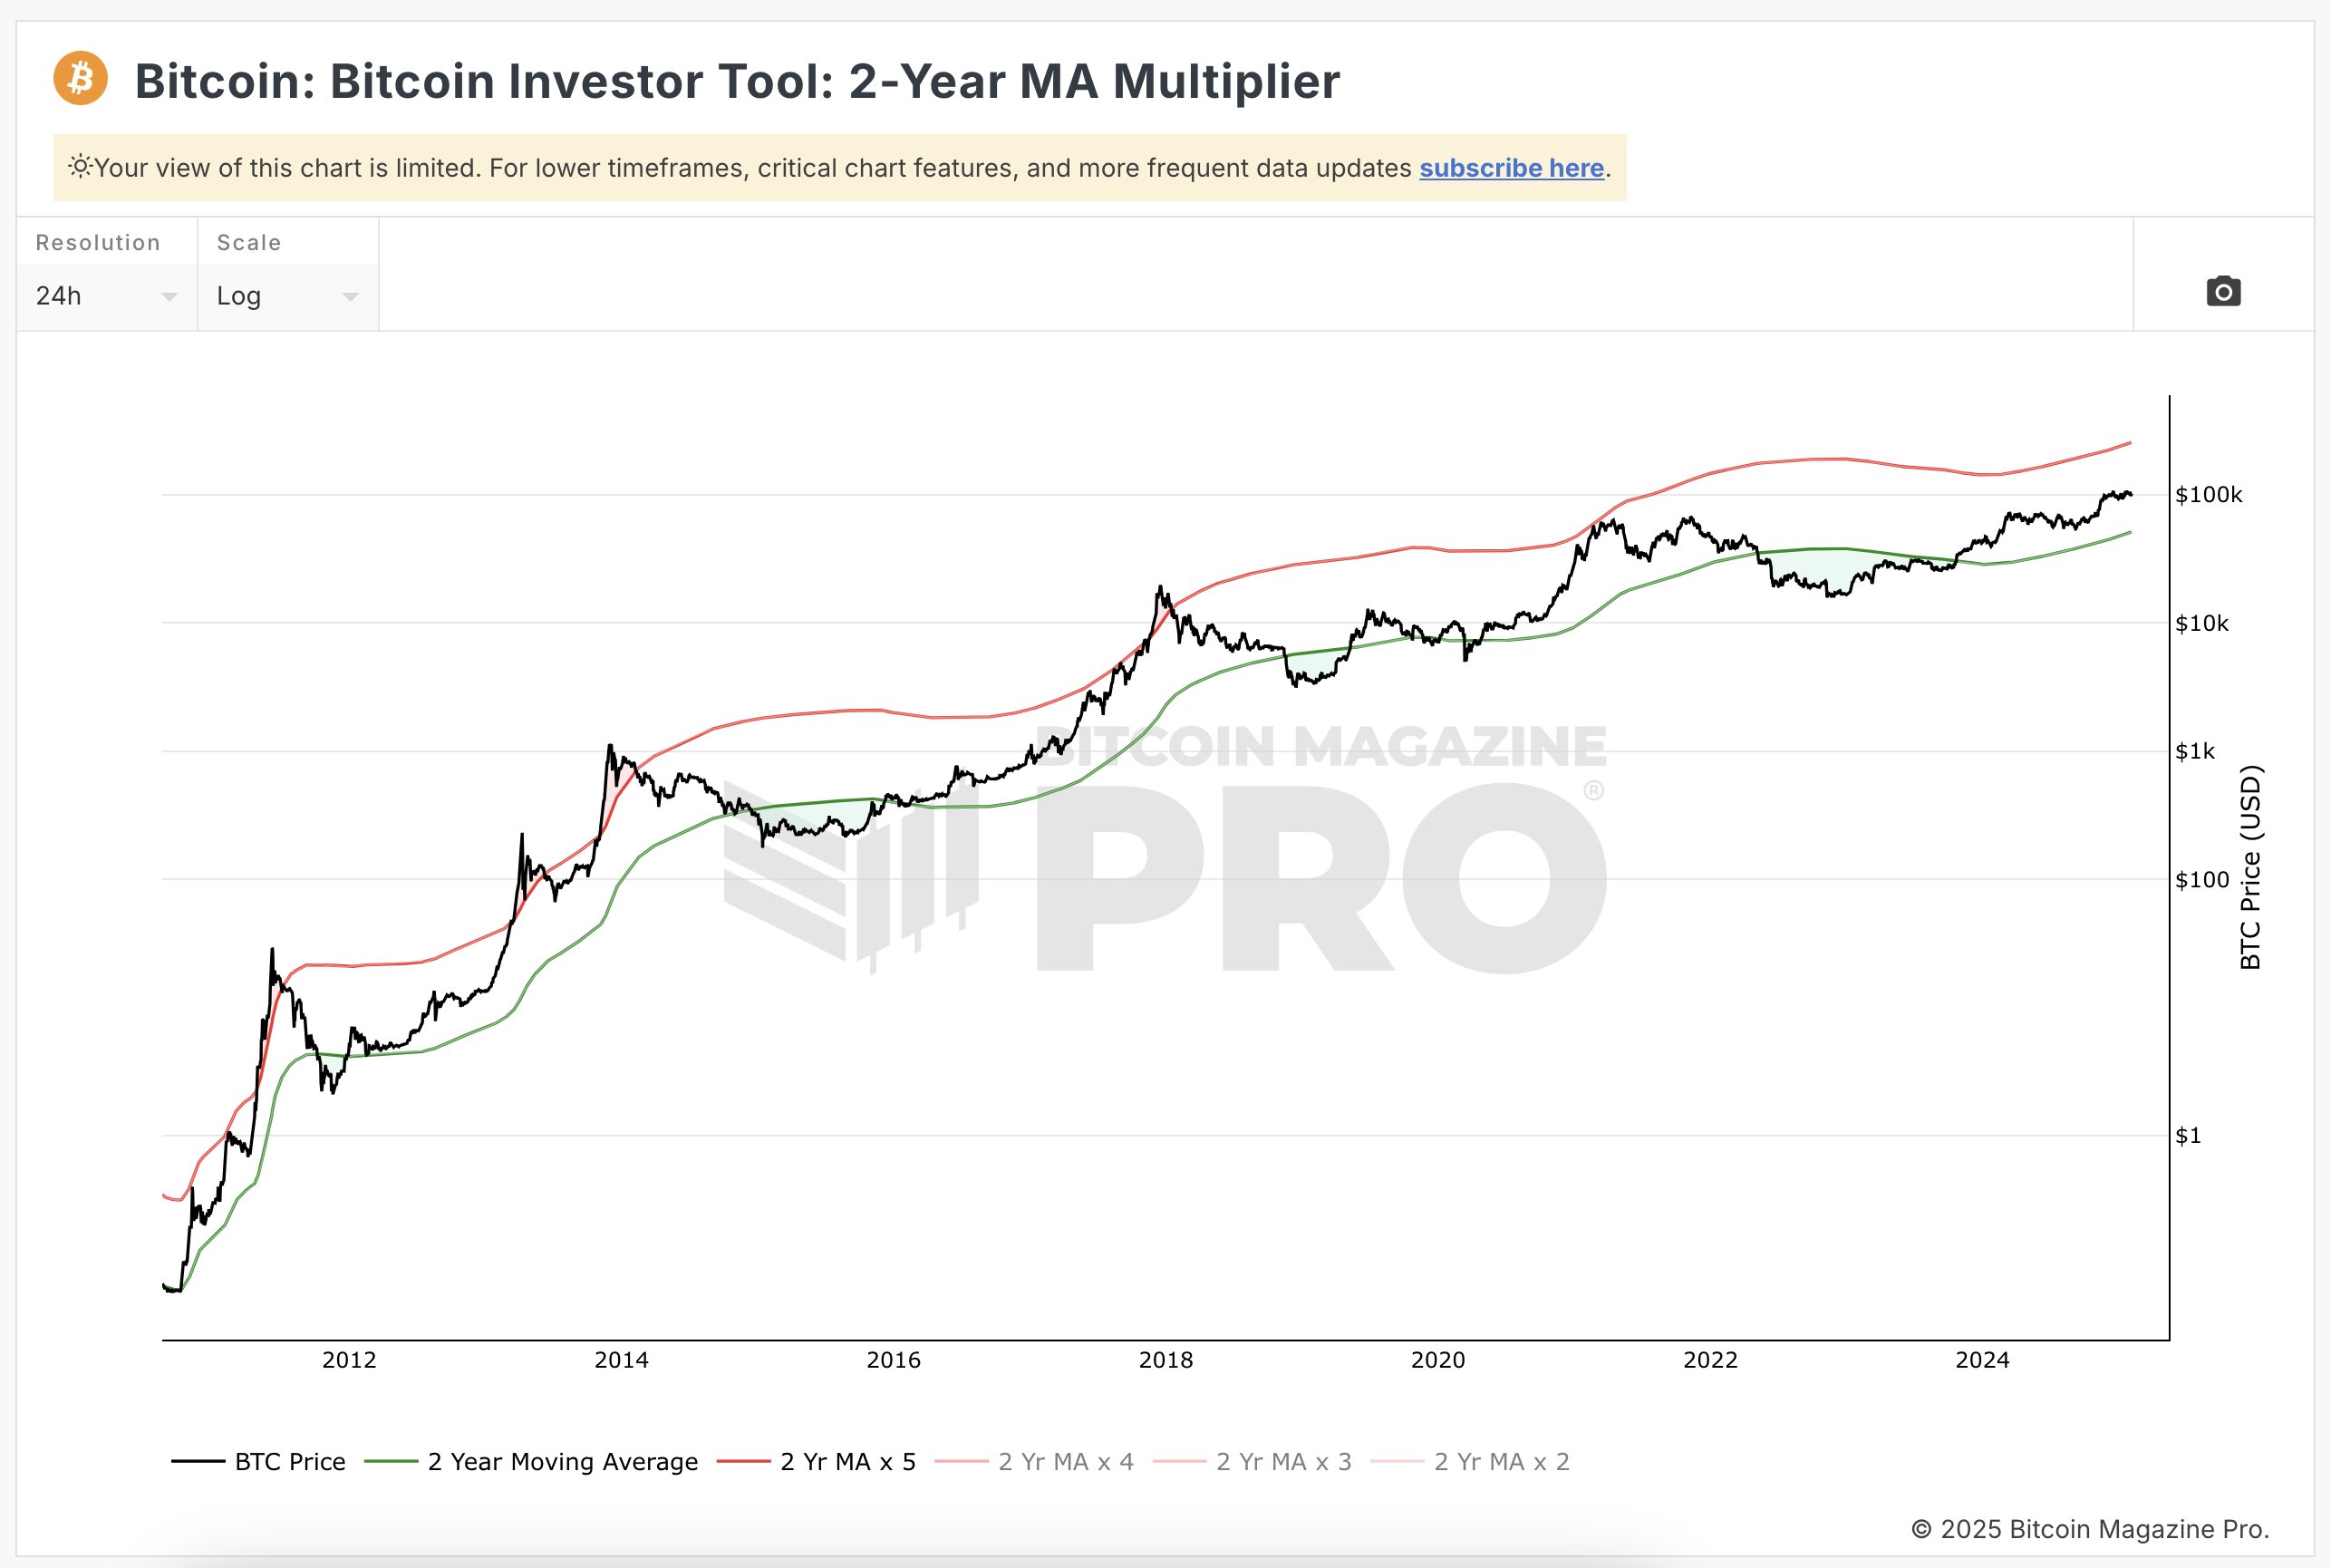
#5 2-Year MA Multiplier
The 2-Year Moving Average Multiplier is another widely referenced model that compares Bitcoin’s current price to its two-year moving average. “The 2-Year MA Multiplier shows that the price of $BTC is in the middle of the red and green lines. It has not touched the red line and the market has not reached the top yet.”
Historically, Bitcoin’s price nearing or surpassing the upper red line has often coincided with cycle peaks. Since Bitcoin remains in a mid-range position, the data suggests that a top may not have materialized yet—though this does not eliminate the risk of further volatility.
Overall, Lookonchain’s analysis, based on these five indicators, points to a conclusion that the top of Bitcoin’s current market cycle may remain undiscovered.
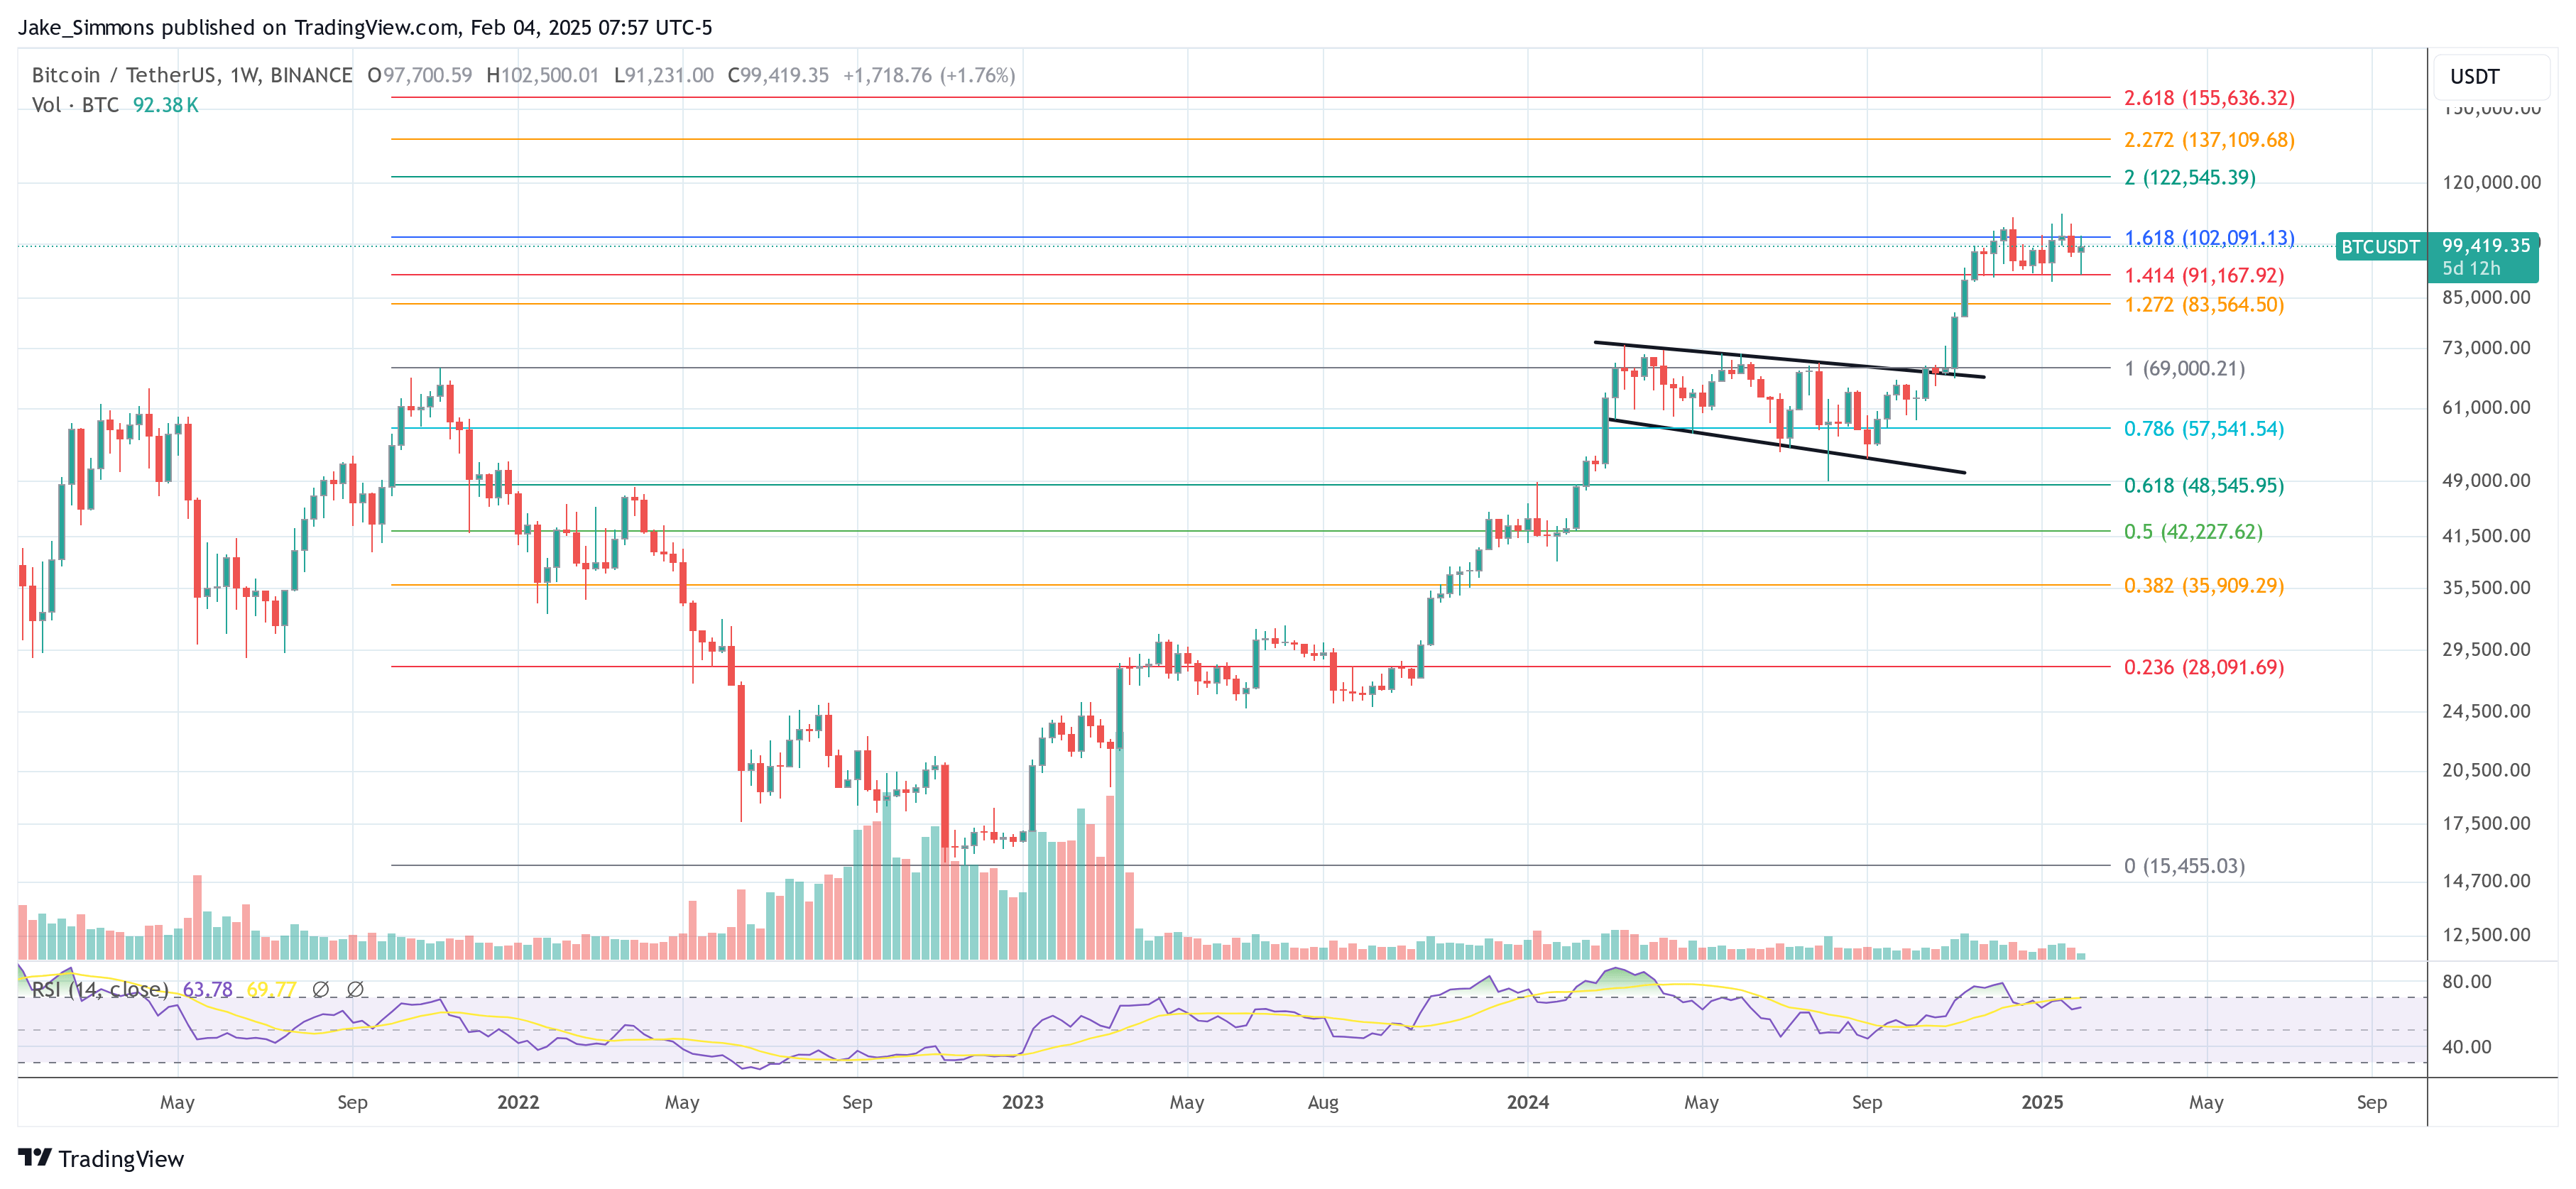
At press time, BTC traded at $99,419.
Featured image created with DALL.E, chart from TradingView.com
Credit: Source link