• Live Crypto Prices
  • Crypto News
    • Worldwide
      • Bitcoin
      • Ethereum
      • Altcoin
      • Blockchain
      • Regulation
    • Australian Crypto News
  • Education
    • Cryptocurrency For Beginners
    • Where to Buy Cryptocurrency
    • Where to Store Cryptos
    • Cryptocurrency Tax in Australia 2021
No Result
View All Result
CryptoABC.net
No Result
View All Result

Bitcoin Could Be Ready For ‘Phase 2’ Of This Historical Bull Pattern

November 9, 2024
in Bitcoin
Reading Time: 2min read
0 0
A A
0
Bitcoin Could Be Ready For ‘Phase 2’ Of This Historical Bull Pattern
0
SHARES
20
VIEWS
ShareShareShareShareShare

On-chain data shows Bitcoin could currently be following a similar pattern as in a previous cycle in terms of this indicator.

Bitcoin Could Now Be Entering Phase 2 Of The Bull Run

In a CryptoQuant Quicktake post, an analyst has pointed out how the recent trend in the Bitcoin long-term holder supply has been reminiscent to what was observed in the 2017 cycle.

The long-term holders (LTHs) make up for one of the two main divisions of the BTC userbase done on the basis of holding time, with the other side being known as the short-term holders (STHs).

The cutoff between these two cohorts is 155 days, with investors who bought inside this window being part of the STHs, while those holding since more than it falling in the LTHs.

Statistically, the longer an investor holds onto their coins, the less likely they become to sell said coins at any point. Thus, the LTHs are considered to include the more resolute market participants.

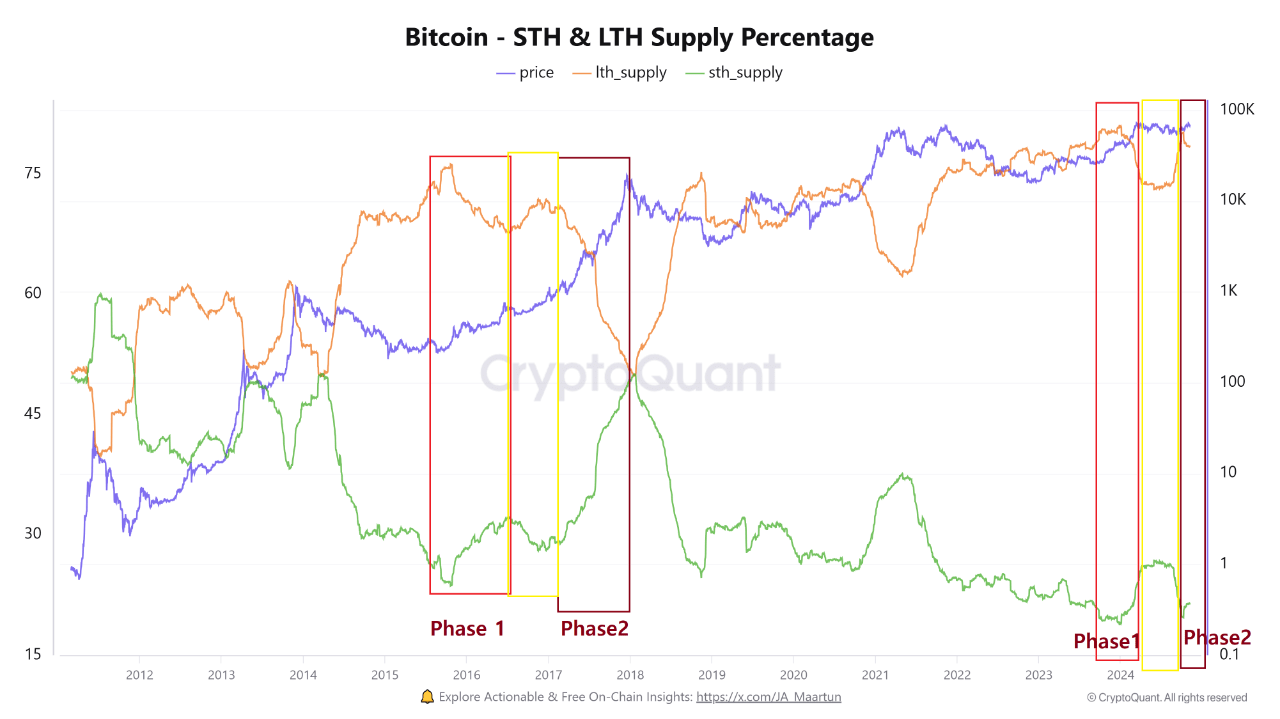
Below is a chart that shows the trend in the combined amount of supply held by the participants of the respective Bitcoin groups.

As is visible in the graph, the Bitcoin LTH supply observed a sharp decline back during the rally of the first quarter of the year, suggesting that even these diamond hands couldn’t resist the temptation of profit-taking.

Alongside this decrease in the LTH supply, the STH supply naturally went up, as whenever the LTHs transfer their tokens on the blockchain, they become part of the STH cohort instead.

Recently, the LTH supply had reversed this drawdown from earlier in the year, but with the latest rally to the new all-time high (ATH), the metric has again switched directions.

In the chart, the quant has highlighted how a similar pattern was also witnessed back during the 2017 cycle; a first phase of distribution from the LTHs was followed by accumulation, which then led to a second phase of distribution.

It’s possible that the latest turnaround in the LTH supply is the start of the phase 2 distribution for the current cycle, where fresh capital flows in to take coins off the hands of the HODLers.

The LTH supply isn’t the only metric that’s showing a trend that matches that of the previous cycle. As the chart shared by the analyst shows, the Bitcoin Binary CDD is also forming an interesting pattern.

Bitcoin Binary CDD

The Binary Coin Days Destroyed (CDD) basically tells us about whether the HODLers are selling less or more than the historical average. From the graph, it’s apparent that the 152-day moving average (MA) of this metric may be showing a second breakout similar to the one that led into the 2021 bull run.

BTC Price

Bitcoin continues to be in ATH exploration mode as its price is trading around $75,900.

Bitcoin Price Chart
Credit: Source link

ShareTweetSendPinShare
Previous Post

Ethereum ETFs Record Largest Inflows Since August 6

Next Post

Ethereum Rival Solana in All-Time High ‘Waiting Room,’ Says Crypto Analyst – Here’s His Outlook

Next Post
Ethereum Rival Solana in All-Time High ‘Waiting Room,’ Says Crypto Analyst – Here’s His Outlook

Ethereum Rival Solana in All-Time High ‘Waiting Room,’ Says Crypto Analyst – Here’s His Outlook

You might also like

0x Opens Swap API To AI Agents With USDC Pay-Per-Request Model

0x Opens Swap API To AI Agents With USDC Pay-Per-Request Model

June 24, 2026
US Senate CBDC Ban Puts Fed Digital Dollar Plans On Ice Unti

US Senate CBDC Ban Puts Fed Digital Dollar Plans On Ice Unti

June 23, 2026
Bitcoin Slides Below $62K as Crypto and Tech Stocks Sell Off Together

Bitcoin Slides Below $62K as Crypto and Tech Stocks Sell Off Together

June 24, 2026
Why Is Crypto Up Today? – October 15, 2025

Bitcoin Price Prediction: Post Deribit Settlement, BTC Survived the Selling Wave

June 26, 2026
Ethereum MEV Bot ‘Jaredfromsubway.eth’ $7.5M Exploit Analysis

Ethereum MEV Bot ‘Jaredfromsubway.eth’ $7.5M Exploit Analysis

June 21, 2026
You Will Not Like Where Grok AI Predicts Bitcoin Going in The Next 30 Days

You Will Not Like Where Grok AI Predicts Bitcoin Going in The Next 30 Days

June 25, 2026
CryptoABC.net

This is an Australian online news/education portal that aims to provide the latest crypto news, real-time updates, education and reviews within Australia and around the world. Feel free to get in touch with us!

What's New Here!

Bitcoin Trapped as Liquidation Maps Spot Major Resistance an

Bitcoin Trapped as Liquidation Maps Spot Major Resistance an

June 27, 2026
Iran rejects US Hormuz hotline as Polymarket sees just 3.55% for normal traffic

Iran rejects US Hormuz hotline as Polymarket sees just 3.55% for normal traffic

June 27, 2026

Subscribe Now

  • Contact Us
  • Privacy Policy
  • Terms of Use
  • DMCA

© 2021 cryptoabc.net - All rights reserved!

No Result
View All Result
  • Live Crypto Prices
  • Crypto News
    • Worldwide
      • Bitcoin
      • Ethereum
      • Altcoin
      • Blockchain
      • Regulation
    • Australian Crypto News
  • Education
    • Cryptocurrency For Beginners
    • Where to Buy Cryptocurrency
    • Where to Store Cryptos
    • Cryptocurrency Tax in Australia 2021

© 2021 cryptoabc.net - All rights reserved!

Welcome Back!

Login to your account below

Forgotten Password?

Create New Account!

Fill the forms below to register

All fields are required. Log In

Retrieve your password

Please enter your username or email address to reset your password.

Log In
Please enter CoinGecko Free Api Key to get this plugin works.