• Live Crypto Prices
  • Crypto News
    • Worldwide
      • Bitcoin
      • Ethereum
      • Altcoin
      • Blockchain
      • Regulation
    • Australian Crypto News
  • Education
    • Cryptocurrency For Beginners
    • Where to Buy Cryptocurrency
    • Where to Store Cryptos
    • Cryptocurrency Tax in Australia 2021
No Result
View All Result
CryptoABC.net
No Result
View All Result

Is This Bitcoin’s Last Big Drop? Expert Points To Key Indicator

October 3, 2024
in Bitcoin
Reading Time: 4min read
0 0
A A
0
Is This Bitcoin’s Last Big Drop? Expert Points To Key Indicator
0
SHARES
11
VIEWS
ShareShareShareShareShare

Este artículo también está disponible en español.

In his latest video analysis titled “BITCOIN’S One Indicator Signaling LAST Major Dip,” Dan Gambardello, a noted crypto analyst with 370,000 subscribers on YouTube, delves into the latest price action of Bitcoin to forecast what could potentially be the final major dip. After dropping as low as $60,000 on Wednesday, the fear of another deeper price crash has grabbed the Bitcoin market.

Why This Could Be The Final Leg Down For Bitcoin

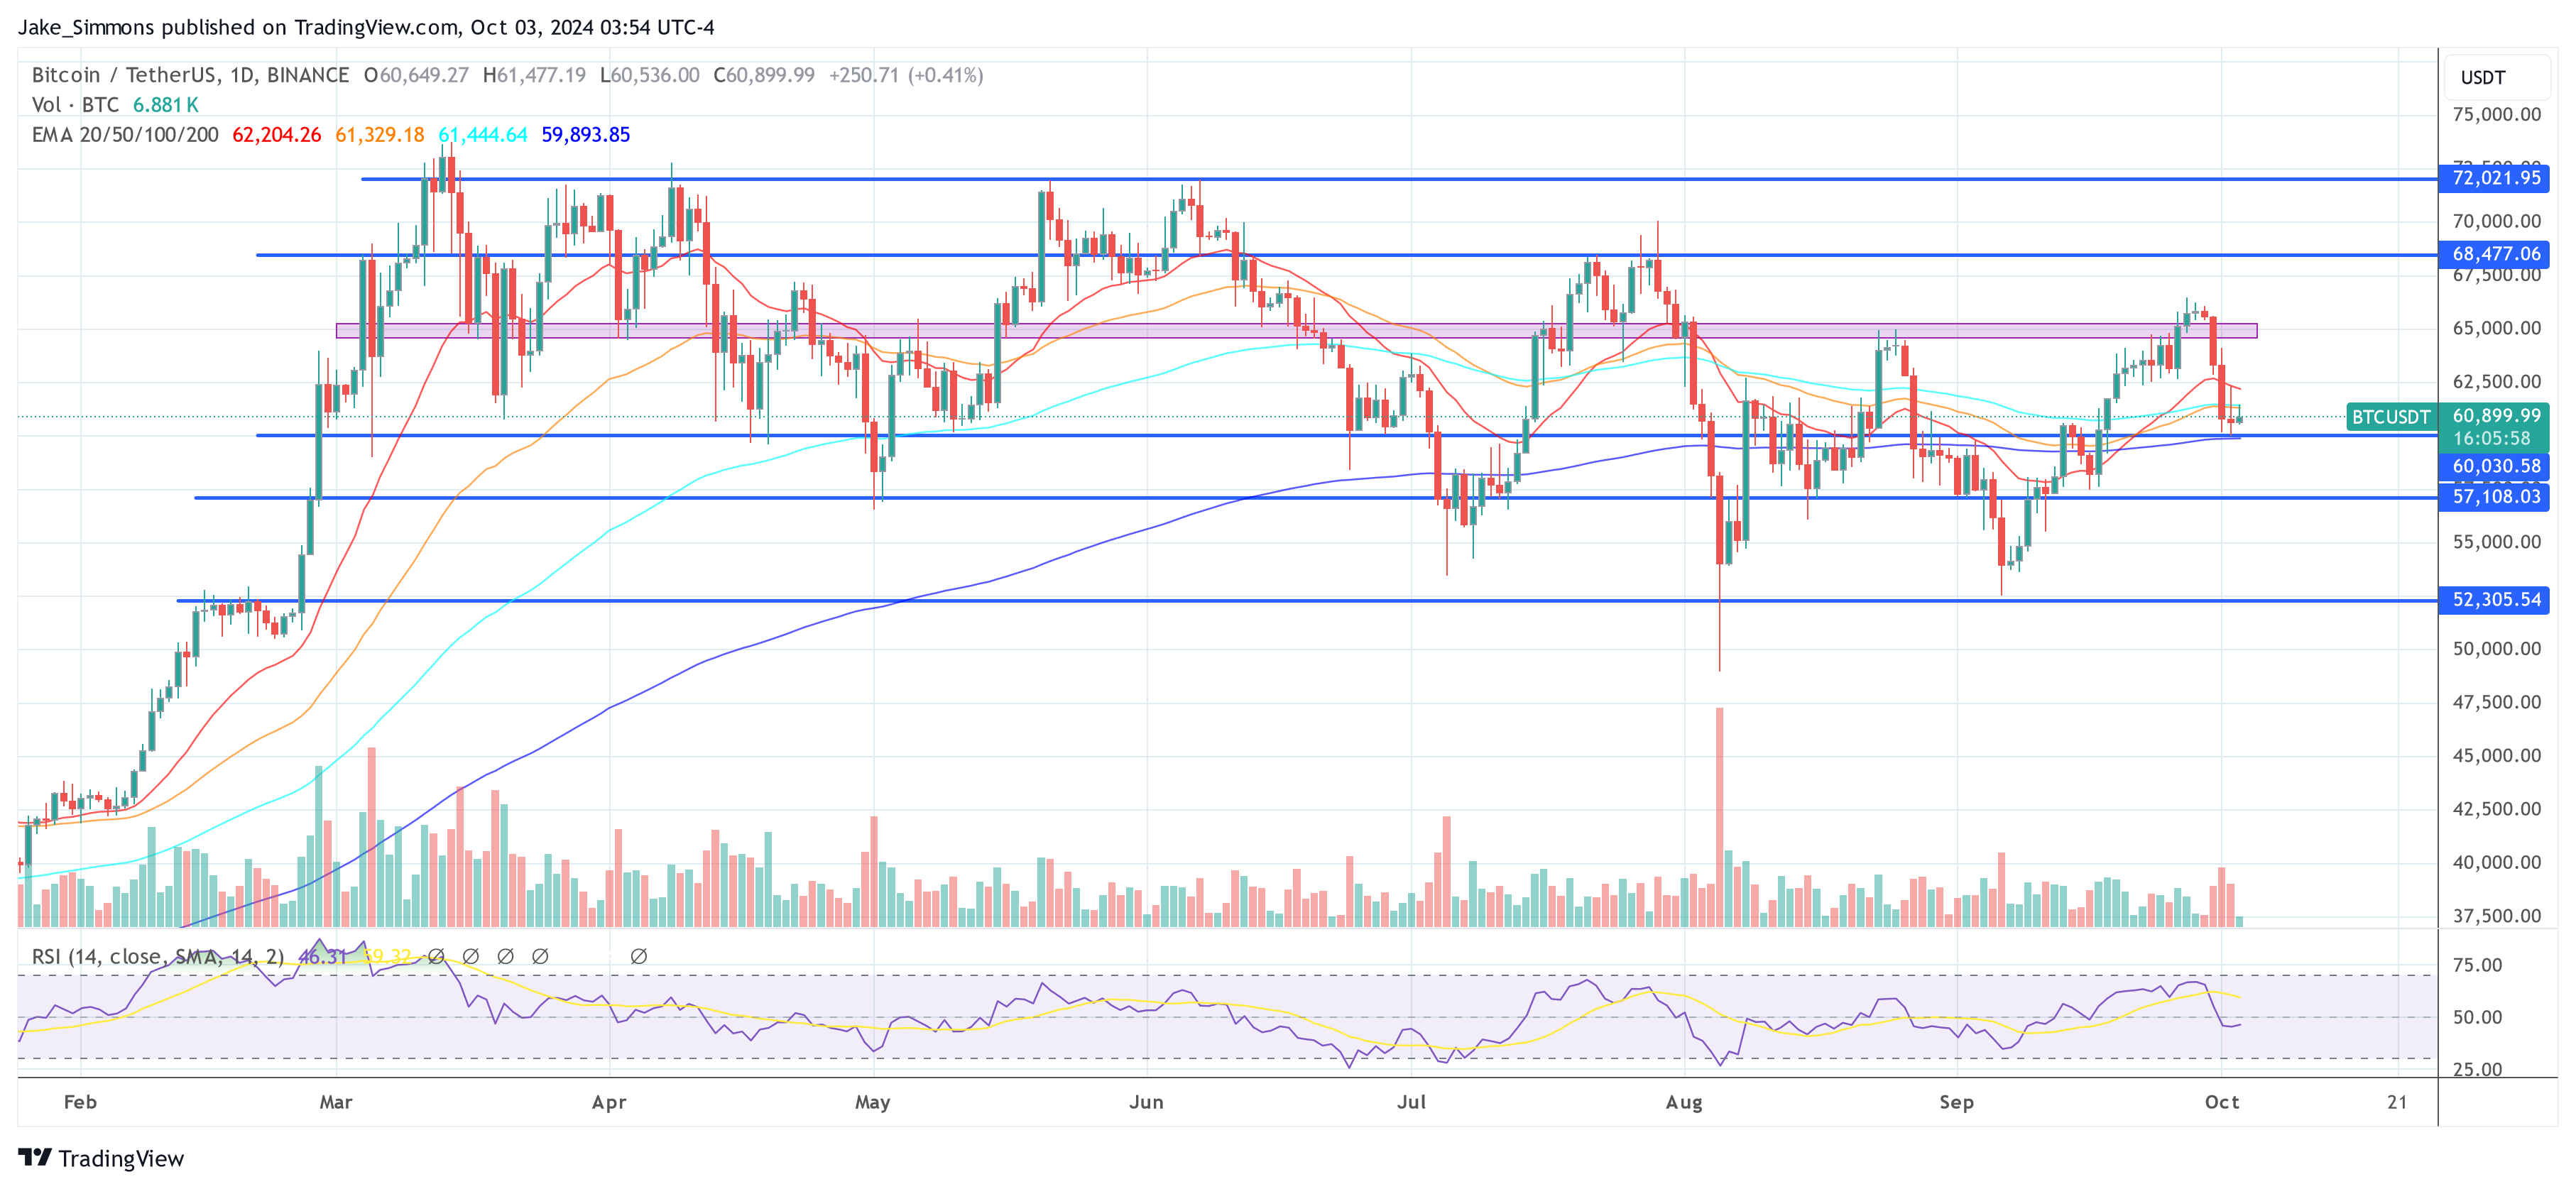
Gambardello emphasizes the significance of the daily and six-hour charts. On the daily chart, Bitcoin is currently testing the 50-day moving average, a level that often serves as a litmus test for short-term market sentiment.

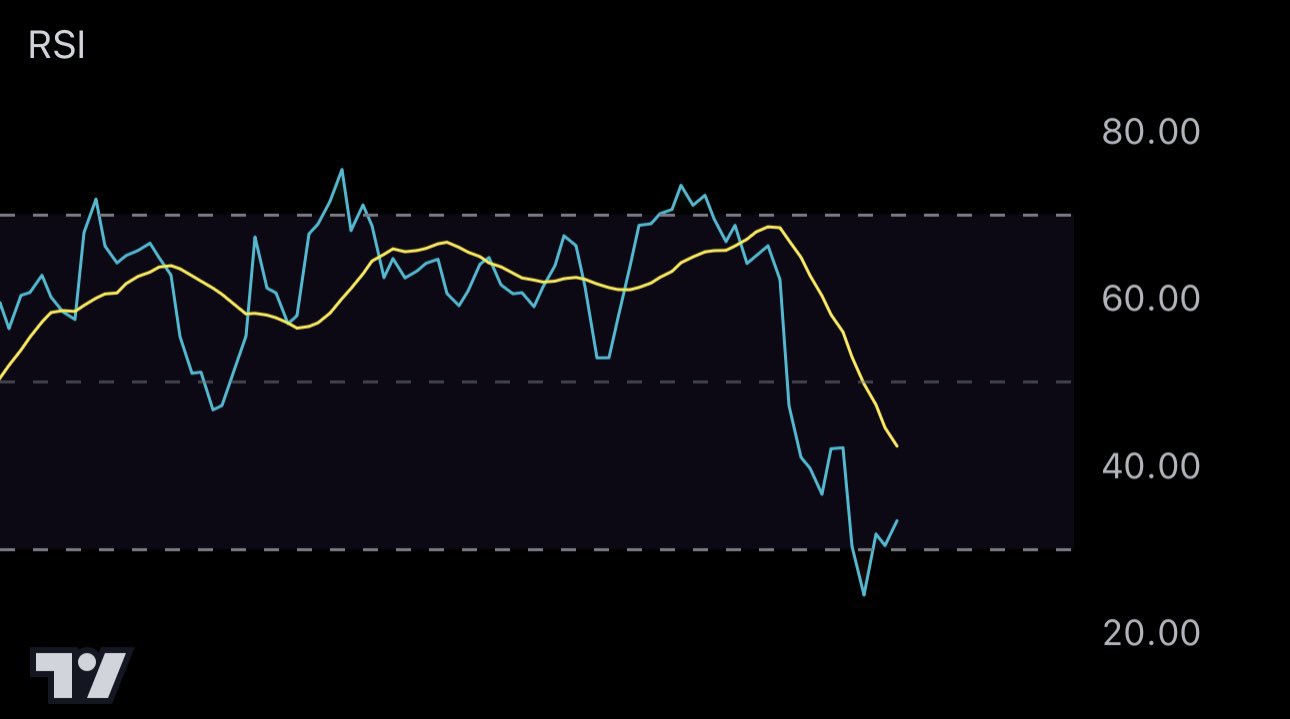
However, the analyst’s main focus is on the six-hour chart’s Relative Strength Index (RSI), a momentum oscillator used to measure the speed and change of price movements, which has hit oversold levels. According to Gambardello, the RSI reaching oversold territory is traditionally viewed as a bullish signal, potentially indicating an approaching end to the current price dip.

Related Reading

“The bottom is actually, I think, close. There could be some type of capitulation in the very short term, but I think there could be a very strong bounce after that happens,” Gambardello noted, suggesting that despite the immediate market turmoil following the Israel-Iran conflict news, the fundamentals point towards an eventual robust recovery.

Via X, Gambardello added, “Nothing like a 6 hour oversold RSI at the beginning of bull season. Also great during bull season.”

Oversold RSI on the 6-hour chart | Source: X @cryptorecruitr

This assertion is grounded in his analysis of past market behaviors during similar conditions, reinforcing the cyclical nature of Bitcoin’s market dynamics. Drawing parallels to historical data, Gambardello highlights the behavioral trends of Bitcoin in previous Octobers, noting a pattern of initial declines followed by strong recoveries by the end of the month.

“October will close green. It’s always [like this] with the dip. People are just freaking out. I guess that’s it, but this gives us a little time. We’re getting all these red candles going into October, give us another week, maybe even two and we could get a pump, a breakout to the upside to end October,” Gambardello claims.

Related Reading

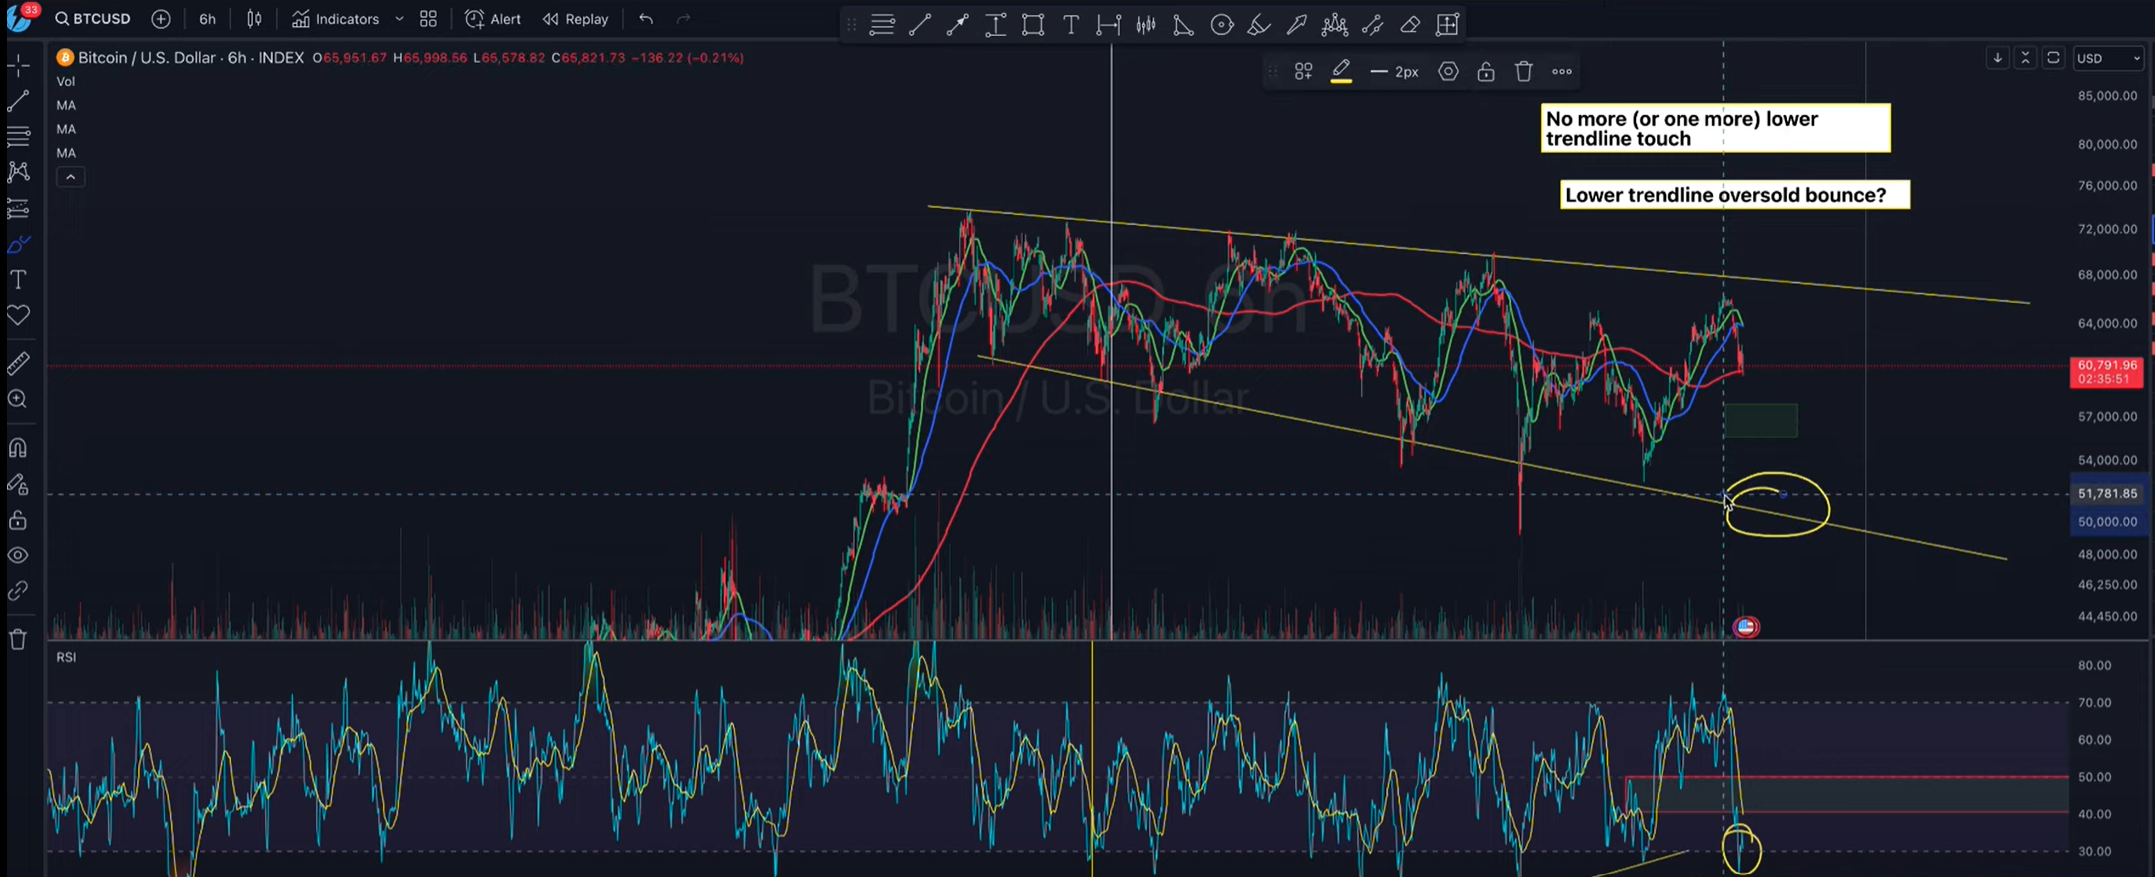
Further deepening the analysis, Gambardello discusses the potential scenarios around Bitcoin’s lower trend line, a recurrent support level over the past six months. He speculates that if Bitcoin approaches this trend line again, it could effectively serve as a robust support level, potentially marking the last significant downturn before a sustained upward trend.

Notably, one final touch of the trendline could bring down the BTC price as low as $50,000. However, Gambardello thinks that this is a less likely scenario as the 6-hour RSI has already hit oversold territory while BTC is currently bouncing off the 50-day moving average.

Bitcoin price chart
Bitcoin price (BTC/USD), 1-day chart | Source: YouTube @Crypto Capital Venture

Moreover, Gambardello refers to Bitcoin’s performance in past halving years, which are typically followed by bull markets, as seen in 2016 and 2020. Gambardello suggests that the current year could follow a similar trajectory. “This is a Halving year. We’ve seen what’s happened in Halving years in 2020 and 2016 in October. Is it going to repeat?”

At press time, Bitcoin traded at $60,899.

Bitcoin price
Bitcoin price holds above $60,000, 1-day chart | Source: BTCUSDT on TradingView.com

Featured image created with DALL.E, chart from TradingView.com

Credit: Source link

ShareTweetSendPinShare
Previous Post

Crypto Analyst Benjamin Cowen Issues Ethereum Warning, Says ETH Could See Bearish Q4 If History Repeats

Next Post

Veteran Crypto Trader Says Bitcoin Is Forming A ‘Three Blind Mice’ Pattern, What Does This Mean?

Next Post
Veteran Crypto Trader Says Bitcoin Is Forming A ‘Three Blind Mice’ Pattern, What Does This Mean?

Veteran Crypto Trader Says Bitcoin Is Forming A 'Three Blind Mice' Pattern, What Does This Mean?

You might also like

What’s Happening With The Bitcoin, Ethereum, And Dogecoin Prices Recently?

Why Did Bitcoin Price Crash To $67,000, And Ethereum Price Fell Below $2,000?

March 9, 2026
Hayes Says Hyperliquid’s HYPE Is Headed To $150 By August 2026

Hayes Says Hyperliquid’s HYPE Is Headed To $150 By August 2026

March 10, 2026
HBAR Price Prediction: Targeting $0.30 by December 2025 as Hedera Tests Critical Breakout Level

HBAR Price Prediction: Targets $0.10 Resistance Break by March 2026

March 8, 2026
Binance Pay Now Supports Injective (INJ) for Global Transactions

INJ Burns 178K Tokens as Community BuyBack Delivers 24% Average Returns

March 10, 2026
BitGo Expands Crypto-as-a-Service Across Europe Under MiCAR Framework

BitGo Expands Crypto-as-a-Service Across Europe Under MiCAR Framework

March 4, 2026
Institutional Accumulation: US Bitcoin ETFs and MicroStrategy Drive $1.2B Demand Surge

Institutional Accumulation: US Bitcoin ETFs and MicroStrategy Drive $1.2B Demand Surge

March 4, 2026
CryptoABC.net

This is an Australian online news/education portal that aims to provide the latest crypto news, real-time updates, education and reviews within Australia and around the world. Feel free to get in touch with us!

What's New Here!

Bitcoin Candlestick Structure That Led To Crash To Below $20,000 Last Cycle Just Appeared Again

Bitcoin Candlestick Structure That Led To Crash To Below $20,000 Last Cycle Just Appeared Again

March 10, 2026
Bitcoin Short Bets Surge—Will Bears Get Squeezed?

Bitcoin Short Bets Surge—Will Bears Get Squeezed?

March 10, 2026

Subscribe Now

  • Contact Us
  • Privacy Policy
  • Terms of Use
  • DMCA

© 2021 cryptoabc.net - All rights reserved!

No Result
View All Result
  • Live Crypto Prices
  • Crypto News
    • Worldwide
      • Bitcoin
      • Ethereum
      • Altcoin
      • Blockchain
      • Regulation
    • Australian Crypto News
  • Education
    • Cryptocurrency For Beginners
    • Where to Buy Cryptocurrency
    • Where to Store Cryptos
    • Cryptocurrency Tax in Australia 2021

© 2021 cryptoabc.net - All rights reserved!

Welcome Back!

Login to your account below

Forgotten Password?

Create New Account!

Fill the forms below to register

All fields are required. Log In

Retrieve your password

Please enter your username or email address to reset your password.

Log In
Please enter CoinGecko Free Api Key to get this plugin works.