• Live Crypto Prices
  • Crypto News
    • Worldwide
      • Bitcoin
      • Ethereum
      • Altcoin
      • Blockchain
      • Regulation
    • Australian Crypto News
  • Education
    • Cryptocurrency For Beginners
    • Where to Buy Cryptocurrency
    • Where to Store Cryptos
    • Cryptocurrency Tax in Australia 2021
No Result
View All Result
CryptoABC.net
No Result
View All Result

DOT Price (Polkadot) Reaches Key Juncture, Is This Bulls Trap or Correction?

May 8, 2024
in Bitcoin
Reading Time: 3min read
0 0
A A
0
DOT Price (Polkadot) Reaches Key Juncture, Is This Bulls Trap or Correction?
0
SHARES
11
VIEWS
ShareShareShareShareShare

Polkadot (DOT) is correcting gains from the $7.5 resistance against the US Dollar. The price could start another increase if it stays above the $6.75 support.

  • DOT gained pace and tested the $7.5 resistance level against the US Dollar.
  • The price is trading above the $7.00 zone and the 100 simple moving average (4 hours).
  • There is a short-term expanding triangle forming with resistance at $7.50 on the 4-hour chart of the DOT/USD pair (data source from Kraken).
  • The pair could continue to decline if it fails to stay above the $6.75 support.

Polkadot Price Holds Support

After forming a base above the $6.00 level, DOT price started a decent increase. It broke many hurdles near $6.75 and even spiked above $7.25. A high was formed at $7.46 and the price is now correcting gains, like Ethereum and Bitcoin.

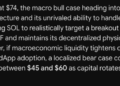
There was a move below the $7.25 support zone. The price declined below the 23.6% Fib retracement level of the upward move from the $6.03 swing low to the $7.46 high.

DOT is now trading above the $7.00 zone and the 100 simple moving average (4 hours). Immediate resistance is near the $7.25 level. The next major resistance is near $7.50. There is also a short-term expanding triangle forming with resistance at $7.50 on the 4-hour chart of the DOT/USD pair.

Source: DOTUSD on TradingView.com

A successful break above $7.50 could start another strong rally. In the stated case, the price could easily rally toward $8.00 in the near term. The next major resistance is seen near the $8.80 zone.

More Downsides in DOT?

If DOT price fails to start a fresh increase above $7.25, it could continue to move down. The first key support is near the $7.00 level and the 100 simple moving average (4 hours).

The next major support is near the $6.75 level or the 50% Fib retracement level of the upward move from the $6.03 swing low to the $7.46 high, below which the price might decline to $6.50. Any more losses may perhaps open the doors for a move toward the $6.10 support zone or $6.00.

Technical Indicators

4-Hours MACD – The MACD for DOT/USD is now losing momentum in the bearish zone.

4-Hours RSI (Relative Strength Index) – The RSI for DOT/USD is now below the 50 level.

Major Support Levels – $7.00, $6.75 and $6.50.

Major Resistance Levels – $7.25, $7.50, and $8.00.

Disclaimer: The article is provided for educational purposes only. It does not represent the opinions of NewsBTC on whether to buy, sell or hold any investments and naturally investing carries risks. You are advised to conduct your own research before making any investment decisions. Use information provided on this website entirely at your own risk.

Credit: Source link

ShareTweetSendPinShare
Previous Post

Standard Chartered Says Donald Trump Presidential Win Could Boost Bitcoin

Next Post

ATO Targets 1.2 Million Crypto Accounts in Major Crackdown on Tax Obligation Awareness

Next Post
ATO Targets 1.2 Million Crypto Accounts in Major Crackdown on Tax Obligation Awareness

ATO Targets 1.2 Million Crypto Accounts in Major Crackdown on Tax Obligation Awareness

You might also like

Is The Market Missing A Catalyst?

Is The Market Missing A Catalyst?

March 13, 2026
Oil Surges Near $100 Stalling Bitcoin Breakout

Oil Surges Near $100 Stalling Bitcoin Breakout

March 12, 2026
Top Expert Projects Bitcoin Bear Market To End In Less Than 365 Days

Bitcoin May Hit $180,000 This Year, But Only If This Scenario Plays Out: Amber Data

March 7, 2026
Bitcoin Candlestick Structure That Led To Crash To Below $20,000 Last Cycle Just Appeared Again

Bitcoin Candlestick Structure That Led To Crash To Below $20,000 Last Cycle Just Appeared Again

March 10, 2026
Kalshi and Polymarket Each Eye $20B Valuations as Prediction Markets Hit $18B Monthly Volume

Kalshi and Polymarket Each Eye $20B Valuations as Prediction Markets Hit $18B Monthly Volume

March 9, 2026
TVL Spikes 23% In Less Than Two Weeks

TVL Spikes 23% In Less Than Two Weeks

March 12, 2026
CryptoABC.net

This is an Australian online news/education portal that aims to provide the latest crypto news, real-time updates, education and reviews within Australia and around the world. Feel free to get in touch with us!

What's New Here!

Bitcoin Stockpiles On Exchanges Hit Lowest Point Since 2019

Bitcoin Stockpiles On Exchanges Hit Lowest Point Since 2019

March 13, 2026
US$50M AAVE Trade Gone Wrong Leaves Trader With Just 324 Tokens

US$50M AAVE Trade Gone Wrong Leaves Trader With Just 324 Tokens

March 13, 2026

Subscribe Now

  • Contact Us
  • Privacy Policy
  • Terms of Use
  • DMCA

© 2021 cryptoabc.net - All rights reserved!

No Result
View All Result
  • Live Crypto Prices
  • Crypto News
    • Worldwide
      • Bitcoin
      • Ethereum
      • Altcoin
      • Blockchain
      • Regulation
    • Australian Crypto News
  • Education
    • Cryptocurrency For Beginners
    • Where to Buy Cryptocurrency
    • Where to Store Cryptos
    • Cryptocurrency Tax in Australia 2021

© 2021 cryptoabc.net - All rights reserved!

Welcome Back!

Login to your account below

Forgotten Password?

Create New Account!

Fill the forms below to register

All fields are required. Log In

Retrieve your password

Please enter your username or email address to reset your password.

Log In
Please enter CoinGecko Free Api Key to get this plugin works.