Dogecoin has jumped 17% in the past 24 hours to break past the $0.21 barrier as on-chain data shows a significant increase in volume for the memecoin.
Dogecoin Beats Market With 17% Rally In The Last Day
Most of the top cryptocurrencies have seen flat returns in the last 24 hours, but Dogecoin has gone its own way as the original meme coin has enjoyed a strong rally.
The below chart shows what the asset’s performance has looked like during the last few days:
The price of the coin appears to have sharply soared over the past day | Source: DOGEUSD on TradingView
In this latest rally, Dogecoin has surged more than 17% in the last 24 hours and has cleared the $0.21 level. Among the top 100 cryptocurrencies by market cap, only Bitcoin Cash (BCH) has registered comparable profits in the same period.
DOGE still beats BCH in the 1-week timeframe, however, as the memecoin has managed returns of more than 40% in this period, while the Bitcoin hard-fork has seen 33%.
The reason behind these two assets in particular seeing a strong performance may lie in the fact that Coinbase plans to add futures products for them starting the 1st of April. Litecoin (LTC) is also set to see a listing on the same day, but its performance has been much weaker than the other two.
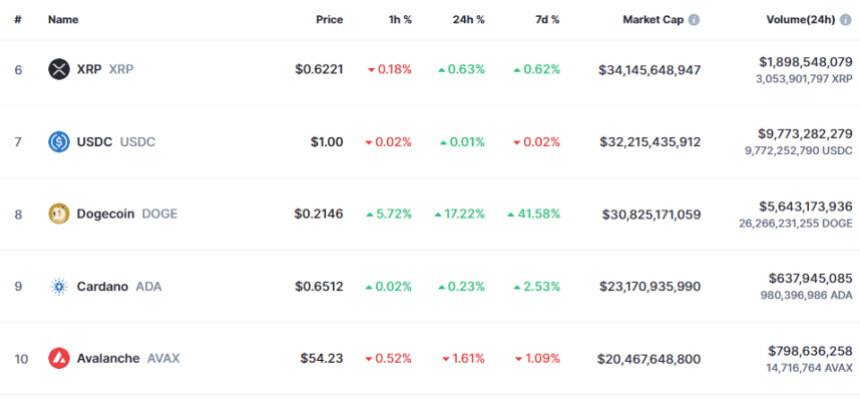
In terms of market cap, Dogecoin is currently the eighth-largest coin in the sector, as the table below shows:

Looks like the market cap of the memecoin is just under $31 billion at the moment | Source: CoinMarketCap
From the table, it’s apparent that the gap to USD Coin (USDC) in seventh isn’t too much right now, so if Dogecoin can keep up its surge, it’s possible that it may be able to flip the stablecoin.
DOGE Transaction Volume Has Observed A Sharp Increase Recently
Something that would confirm that widespread speculation around Dogecoin is ripe for a rally currently would be its Transaction Volume. As a user on X pointed out using data from the on-chain analytics firm Santiment, DOGE’s Transaction Volume has shot up recently.
The “Transaction Volume” keeps track of the total amount of tokens (in USD) for a given cryptocurrency that has observed some movement on the blockchain in the past 24 hours.
When the value of this metric is high, it means that the users are transacting large amounts on the network right now. Such a trend implies the trading interest around the asset is high currently.
On the other hand, low values of the indicator can be a sign that the general interest in the cryptocurrency, both as an asset and a network, is low at the moment.
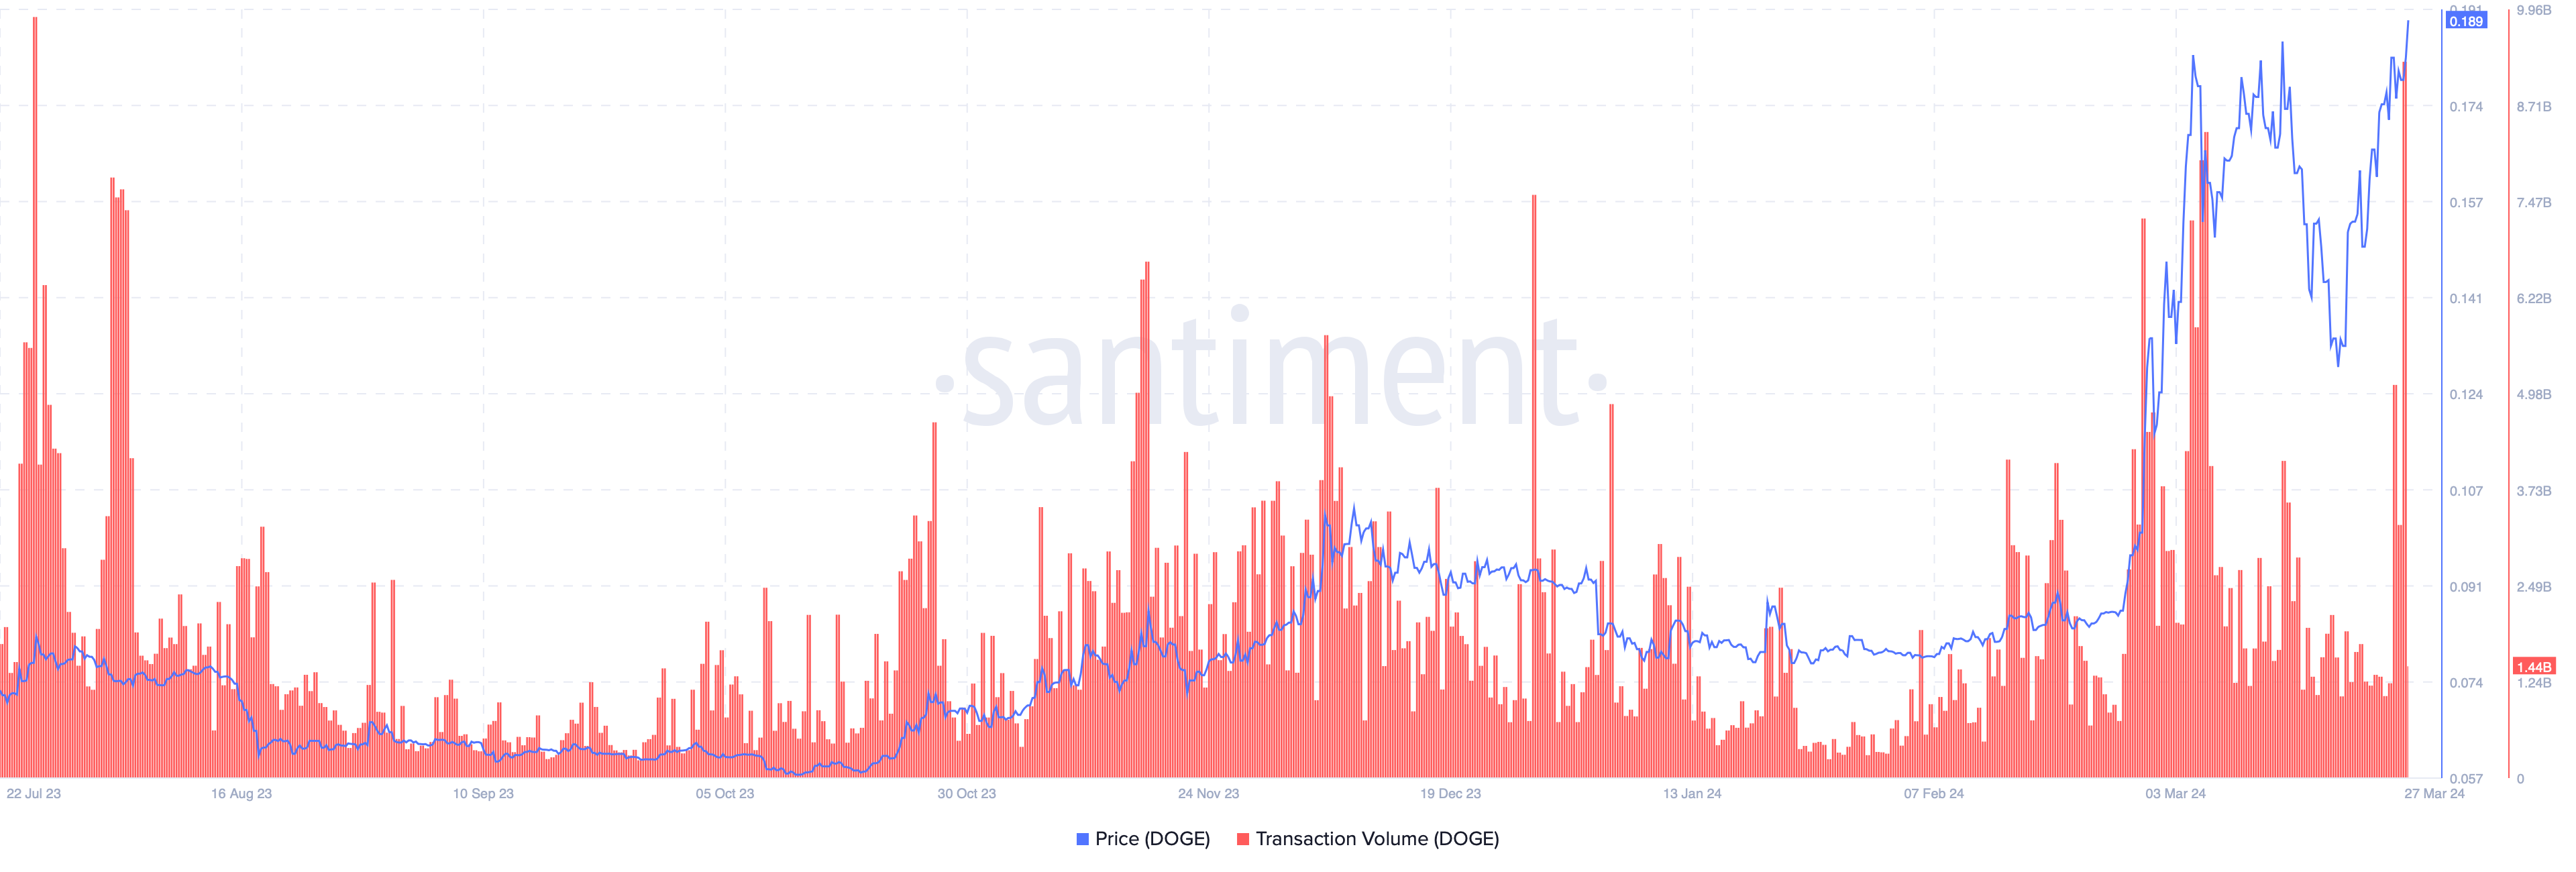
Now, here is a chart that shows the trend in the Dogecoin Transaction Volume over the past year:
The metric seems to have gone up in recent days | Source: @trader_kamikaze on X
As is visible in the chart, the Dogecoin Transaction Volume has experienced quite a boost recently, and what has accompanied this rise has been the latest rally.
A rising volume can often be a positive sign for the sustainability of any rally, as it means that interest in the asset is going up, and thus, more fuel is potentially coming in.
Something to keep in mind, though, is that selling and buying alike affect this indicator, so a mass selloff would also register as a spike in the metric. Thus, while high volumes are usually a requirement for rallies to continue (as without interest, the run can easily die down), they alone can’t predict a further rise, as the nature of this activity can be hard to ascertain.
Featured image from Kanchanara on Unsplash.com, Santiment.net, chart from TradingView.com
Disclaimer: The article is provided for educational purposes only. It does not represent the opinions of NewsBTC on whether to buy, sell or hold any investments and naturally investing carries risks. You are advised to conduct your own research before making any investment decisions. Use information provided on this website entirely at your own risk.
Credit: Source link


