• Live Crypto Prices
  • Crypto News
    • Worldwide
      • Bitcoin
      • Ethereum
      • Altcoin
      • Blockchain
      • Regulation
    • Australian Crypto News
  • Education
    • Cryptocurrency For Beginners
    • Where to Buy Cryptocurrency
    • Where to Store Cryptos
    • Cryptocurrency Tax in Australia 2021
No Result
View All Result
CryptoABC.net
No Result
View All Result

Why “Overbought” Bitcoin Could Trigger A 107% Rally

January 31, 2024
in Bitcoin
Reading Time: 3min read
0 0
A A
0
Why “Overbought” Bitcoin Could Trigger A 107% Rally
0
SHARES
11
VIEWS
ShareShareShareShareShare

Bitcoin price had previously been showing extreme strength leading up until the debut of the first spot ETFs. That strength has since subsided, leading to a 20% correction in BTCUSD.

A popular technical indicator that measures momentum, however, could point to powerful continuation to the upside, but only if a certain level is breached. Keep reading to learn more about the Relative Strength Index and how the top cryptocurrency behaves once the market reaches an “overbought” level.

Bitcoin Approaches “Overbought” And Why This Isn’t A Bad Thing

The Relative Strength Index is a momentum-measuring tool that signals when a market is “overbought” or “oversold”. When a financial asset reaches such conditions, it often means the trend is about to change.

In Bitcoin and other cryptocurrencies, the weekly RSI is often a signal that the asset is moving into its most powerful phase. For example, Bitcoin made it above a reading of 70 in October 2023, and only weeks later saw an over 60% rally to local 2024 highs.

Now 1W BTCUSD charts are showing an RSI reading of just below 70, pointing to a possible close back above the overbought level. If bulls can keep the top cryptocurrency by market cap above $43,650, the weekly RSI should close above the threshold.

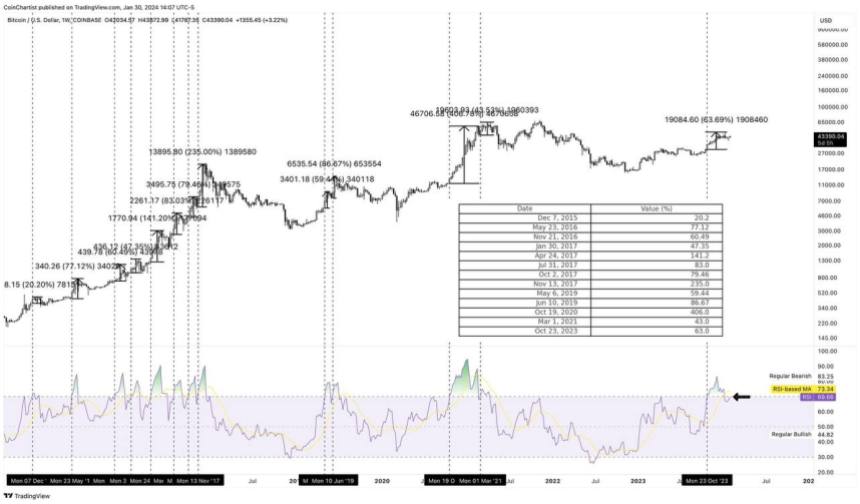
The average move is 107% | BTCUSD on TradingView.com

BTCUSD Historical 1W Relative Strength Data

Historical data could possibly shed some light on what might happen if the weekly Relative Strength Index gets the close above 70 as anticipated.

Over the last ten years, Bitcoin saw a 1W RSI close above 70 a total of 13 times. This happened 8 times in 2016 and 2017, twice in 2019, and once each in 2020 and 2021. One additional instance occurred in 2023.

Of the 13 times, the average gain after the RSI closed above 70 to the peak of the movement was 107%. The largest rally was in 2020, bringing over 400% returns. The smallest rally was in 2016 and saw only a 20% gain.

After removing the largest and smallest outliers, the average drops down to around 61%. This could mean that Bitcoin could produce on average a move between 61 and 107%.

A 61% gain takes BTCUSD back to just under $68,000 and shy of a new all-time high, while a 107% move sets a new record closer to $90,000 per coin. The cryptocurrency is also potentially working on a bull flag pattern, with a target of around $77,000.

Bitcoin bull flag rsi

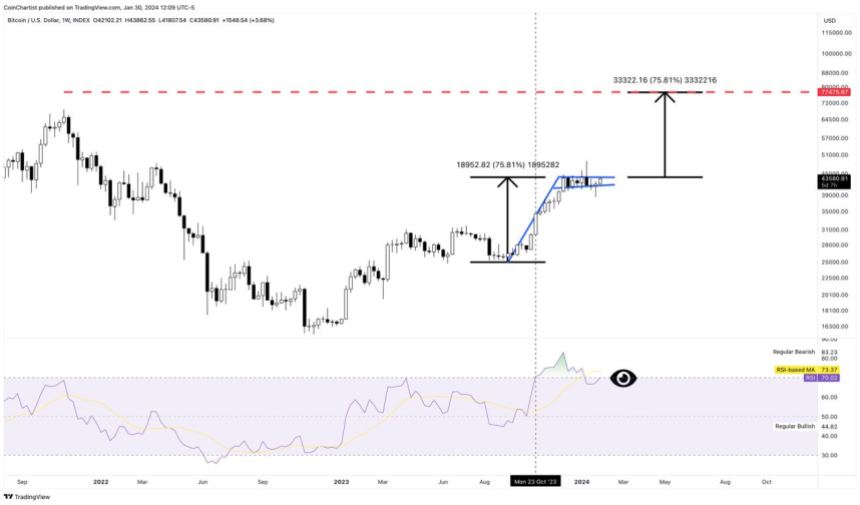
The 75% target is within historical averages | BTCUSD on TradingView.com

Disclaimer: The article is provided for educational purposes only. It does not represent the opinions of NewsBTC on whether to buy, sell or hold any investments and naturally investing carries risks. You are advised to conduct your own research before making any investment decisions. Use information provided on this website entirely at your own risk.

Credit: Source link

ShareTweetSendPinShare
Previous Post

Crypto Analyst Predicts Bitcoin To Reach $60,000, Here’s Why

Next Post

Shiba Inu Prints Rare Bullish Signal, Eyes This Price Target

Next Post
Shiba Inu Prints Rare Bullish Signal, Eyes This Price Target

Shiba Inu Prints Rare Bullish Signal, Eyes This Price Target

You might also like

XRP OI Z-Score Just Dropped To Levels Seen Before Its 600% Rally In 2024

XRP OI Z-Score Just Dropped To Levels Seen Before Its 600% Rally In 2024

April 28, 2026
HBAR Price Prediction: Targeting $0.30 by December 2025 as Hedera Tests Critical Breakout Level

HBAR Price Prediction: Consolidation at $0.09 Sets Stage for $0.13 Breakout

May 1, 2026
Bitcoin Holdings in Public Company Treasuries Exceed 200,000 BTC

Canada Moves to Ban Crypto Political Donations Amid Transparency Push

April 27, 2026
The Crash Is Over? XRP Price About To Hit ‘Significant Bottom’

The Crash Is Over? XRP Price About To Hit ‘Significant Bottom’

April 25, 2026
AAVE Price Prediction: Testing $240 Breakout with $280 Medium-Term Target Despite Bearish Momentum

AAVE Price Prediction: $114 Breakout Imminent as Whales Load Heavy Bags

April 26, 2026
Why A Surge to $3,400 Could Be The Beginning

Why A Surge to $3,400 Could Be The Beginning

April 27, 2026
CryptoABC.net

This is an Australian online news/education portal that aims to provide the latest crypto news, real-time updates, education and reviews within Australia and around the world. Feel free to get in touch with us!

What's New Here!

Here’s How High The XRP Price Will Be If It Repeats The 2017 Surge

Here’s How High The XRP Price Will Be If It Repeats The 2017 Surge

May 2, 2026
US CLARITY Act Moves Closer To Law After Stablecoin Update

US CLARITY Act Moves Closer To Law After Stablecoin Update

May 2, 2026

Subscribe Now

  • Contact Us
  • Privacy Policy
  • Terms of Use
  • DMCA

© 2021 cryptoabc.net - All rights reserved!

No Result
View All Result
  • Live Crypto Prices
  • Crypto News
    • Worldwide
      • Bitcoin
      • Ethereum
      • Altcoin
      • Blockchain
      • Regulation
    • Australian Crypto News
  • Education
    • Cryptocurrency For Beginners
    • Where to Buy Cryptocurrency
    • Where to Store Cryptos
    • Cryptocurrency Tax in Australia 2021

© 2021 cryptoabc.net - All rights reserved!

Welcome Back!

Login to your account below

Forgotten Password?

Create New Account!

Fill the forms below to register

All fields are required. Log In

Retrieve your password

Please enter your username or email address to reset your password.

Log In
Please enter CoinGecko Free Api Key to get this plugin works.