Bitcoin, the undisputed king of the cryptocurrency market, is once again at an inflection point. As the pioneer digital asset fast approaches the $29,000 level, traders and investors alike are keeping a keen eye on critical price levels and market indicators to gauge the next possible move.
Fundamental Catalysts
- Bitcoin Spot ETFs: Data analytics firm CryptoQuant has made a bold prediction. If Bitcoin spot ETFs gain approval, Bitcoin’s market cap could soar to $900 billion, with the broader crypto market gaining an additional $1 trillion. Spot ETF approvals in the US, potentially by March 2024, could inject around $155 billion into Bitcoin, pushing its price to somewhere between $50,000 and $73,000.
- Historical Value Surge: Bitcoin’s market value has historically grown 3-5 times more than its realized capitalization. This means that even a modest influx of capital can lead to significant price hikes. A recent false report about a spot Bitcoin ETF approval sent the coin momentarily to the $30,000 mark.
- Market Sentiment: The enthusiasm and optimism surrounding Bitcoin are palpable. The declining discount of the Grayscale Bitcoin Trust (GBTC), at its lowest in nearly two years, reflects this sentiment.
Bitcoin Price
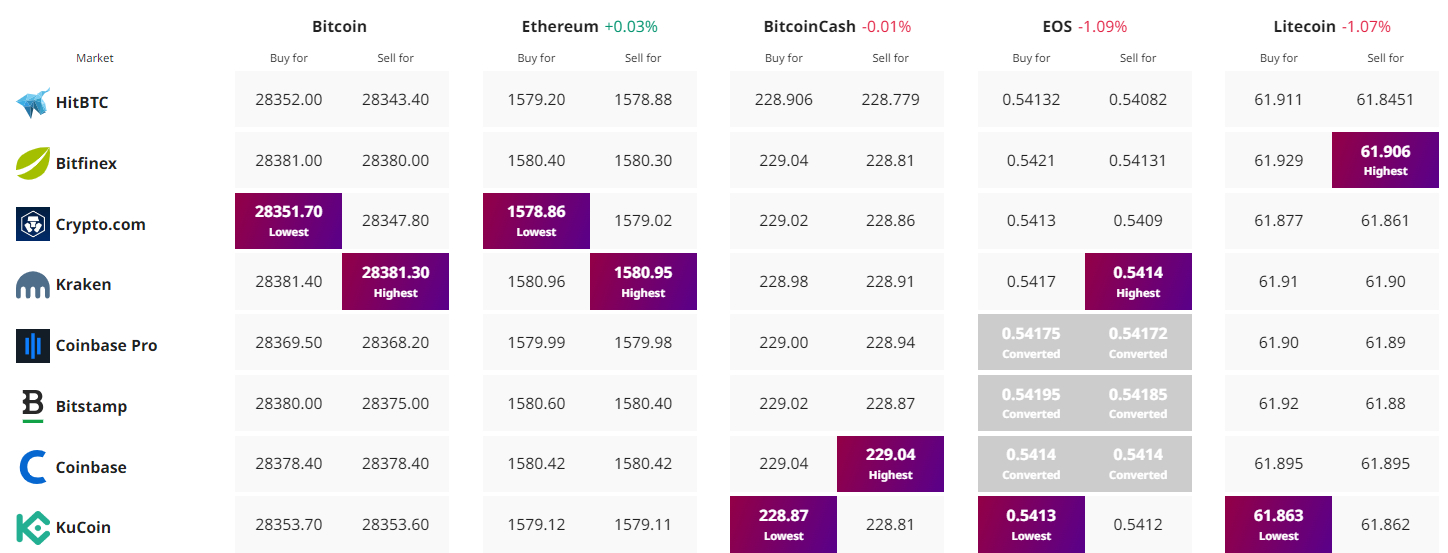
On October 18, Bitcoin’s current standing in the market was as follows:
- Priced at $28,266, the 24-hour trading volume amounted to a whopping $12.73 billion. The market cap stands impressively at $551.69 billion.
- In terms of supply, 19.52 million BTC are in circulation, which will never exceed 21 million BTC, underscoring its scarcity.
- CoinMarketCap, a prominent crypto tracker, currently ranks Bitcoin at the number one spot.
Bitcoin Price Prediction
From a Bitcoin technical analysis perspective, the RSI (Relative Strength Index) paints a moderately bullish picture.
Positioned at 63, it’s a favorable number that’s north of 50, suggesting a bullish sentiment, yet not crossing into the overbought territory of 70.
Conversely, a move below can indicate a bearish phase. Additionally, Bitcoin’s price is hovering above its 50-day Exponential Moving Average (50 EMA) of $27,712, signifying a potential short-term bullish momentum.

Chart patterns lend further insights. Bitcoin seems to be wrestling with the resistance at $28,634. This resistance appears as a triple-top pattern on the chart, a bearish omen.
Additionally, the emergence of Doji candles below this level might indicate a potential bearish turn, suggesting that the bulls might run out of steam.
Summing Up
To conclude, Bitcoin’s current trajectory appears to be bullish as long as it remains above the $28,150 mark. Conversely, a dip below this level could tilt the scales.
In the short run, given the amalgamation of technical indicators and market sentiment, Bitcoin seems primed to challenge the resistance at $28,634 soon.
However, the cryptocurrency domain is notoriously unpredictable. Hence, investors are advised to tread with caution and stay abreast of market developments.
Top 15 Cryptocurrencies to Watch in 2023
Stay up-to-date with the world of digital assets by exploring our handpicked collection of the best 15 alternative cryptocurrencies and ICO projects to keep an eye on in 2023.
Our list has been curated by professionals from Industry Talk and Cryptonews, ensuring expert advice and critical insights for your cryptocurrency investments.
Take advantage of this opportunity to discover the potential of these digital assets and keep yourself informed.
Find The Best Price to Buy/Sell Cryptocurrency

Disclaimer: Cryptocurrency projects endorsed in this article are not the financial advice of the publishing author or publication – cryptocurrencies are highly volatile investments with considerable risk, always do your own research.
Credit: Source link


