Let’s take a closer look at today’s altcoins showing breakout signals. We’ll explain what the coin is, then dive into the trading charts and provide some analysis to help you decide.
1. Ethereum (ETH)
Ethereum ETH is a decentralised open-source blockchain system that features its own cryptocurrency, Ether. ETH works as a platform for numerous other cryptocurrencies, as well as for the execution of decentralised smart contracts. Ethereum’s own purported goal is to become a global platform for decentralised applications, allowing users from all over the world to write and run software that is resistant to censorship, downtime, and fraud.
ETH Price Analysis
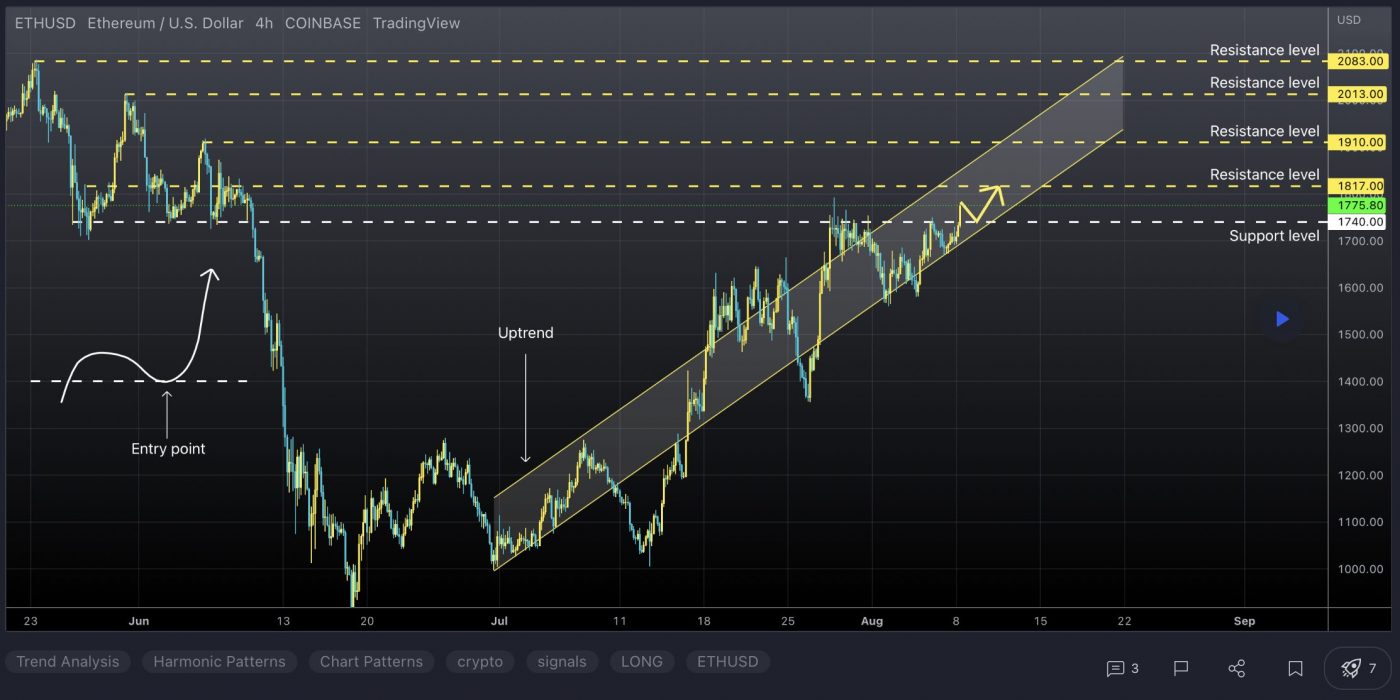
At the time of writing, ETH is ranked the 2nd cryptocurrency globally and the current price is US$1,775.14. Let’s take a look at the chart below for price analysis:

ETH is retracing its April to June decline. So far, it’s retraced approximately 25% of the drop in anticipation of September’s Merge.
A broad area of inefficient trading on the monthly chart, from $1,972.58 to $2,709.26, is likely to provide resistance.
The upper half of this zone, beginning near $2,145.29, may provide stronger resistance. Here, inefficient trading on the weekly chart, old swing lows, and the 50% retracement of H2 2022’s drop converge.
Closer to the current price, $1,784.79 to $1,859.84 may provide the next speedbump for bulls. This level is near the low of previous inefficient trading on the weekly chart in March 2021. It’s also just above more recent inefficient trading on the weekly and a recent daily swing high.
A pocket of inefficient trading on the daily chart, from $1,685.26 to $1,662.79, may provide the closest support. Here, the 9 EMA and the midpoint of late July and early August’s bearish move converge. If the price continues to rally in the earlier part of this week, this level may move higher by the middle of the week.
If this possible support fails, the next support might be near the 40 EMA, from $1,570.48 to $1,493.11. Old swing lows, previous inefficient trading on the weekly chart, and inefficient trading on the daily chart add confluence to this level.
A steeper drop may be aiming for stops under the daily swing low near $1,356.17. From $1,336.07 to $1,197.79, bulls might find support inside accumulation preceding inefficient trading on the weekly chart.
If the price drops below this level, it may be aiming for stops under June’s low. If so, bears may be targeting an area from $881.56 to $758.74. This zone marks the low end of inefficient trading on the monthly and weekly charts.
2. Monero (XMR)
Monero XMR allows transactions to take place privately and with anonymity. Even though it’s commonly thought that BTC can conceal a person’s identity, it’s often easy to trace payments back to their original source because blockchains are transparent. On the other hand, XMR is designed to obscure senders and recipients alike through the use of advanced cryptography. The team behind Monero says privacy and security are their biggest priorities, with ease of use and efficiency coming second. It aims to provide protection to all users irrespective of how technologically competent they are.
XMR Price Analysis
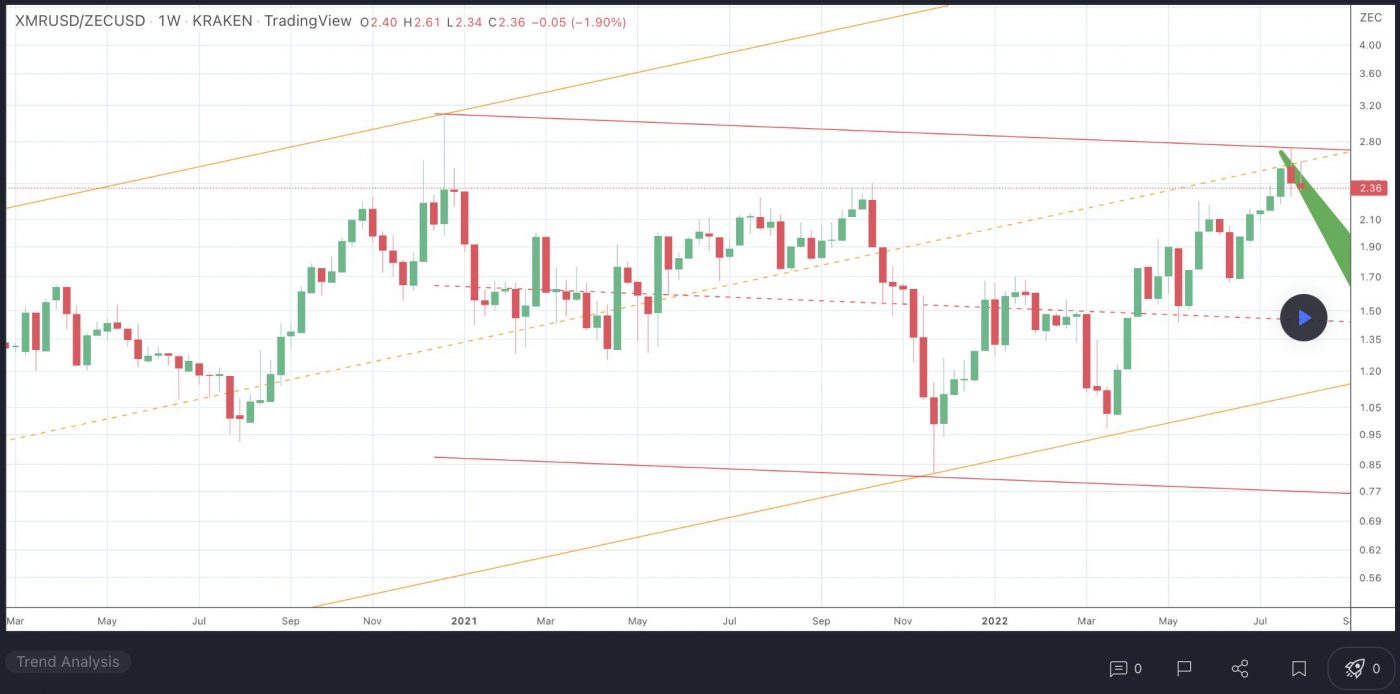
At the time of writing, XMR is ranked the 29th cryptocurrency globally and the current price is US$166.39. Let’s take a look at the chart below for price analysis:

XMR is rallying to fill in pockets of inefficient trading left during its June decline.
The closest resistance is at $167.80. This area of inefficient trading on the weekly and daily charts is near the 61.8% retracement of June’s move. It rejected the price on Sunday, but the price is rechallenging it.
If it breaks, the next pocket of inefficient trading from $178.60 to $182.10 may be the next target. This zone is also near the high of inefficient trading on the weekly and the 78.6% retracement of June’s move.
In the longer term, bulls could be targeting bears’ stops above the significant weekly swing high near $204.50. This zone also shows inefficient trading on the monthly chart. If this resistance breaks, the next bullish target may be another area of inefficient trading on the weekly chart from $233.50 to $229.80.
The closest support might be near the current price, from $166.40 to $162.03. This area is at the end of July’s accumulation high.
If this level breaks, a drop under the August monthly open might find more buyers near $152.30. This area shows accumulation, would run bulls’ stops under recent swing lows, and fill in a tiny pocket of inefficient trading. It also has confluence with the high of previous inefficient trading on the weekly chart.
A steeper drop might reach inefficient trading on the weekly chart, from $135.70 to $133.80. This zone is also near the bottom of previous inefficient trading from June and lines up with old swing lows from Q1 2022.
3. World Mobile Token (WMT)
The World Mobile Token WMT is a digital token that is issued with the purpose of allowing the participants to provide a service on the network and be rewarded accordingly for it. The primary role of WMT is to incentivise both token holders that want to support the operation of the network by way of delegating their WMT stake to a node operator (stakers) as well as node operators that operate their own node. WMT is the utility token at the heart of World Mobile Chain, a solution developed in partnership between Input Output Global and World Mobile to democratize access to digital, financial and social services in Africa, the first of its kind to go the extra mile and connect the unconnected.
WMT Price Analysis
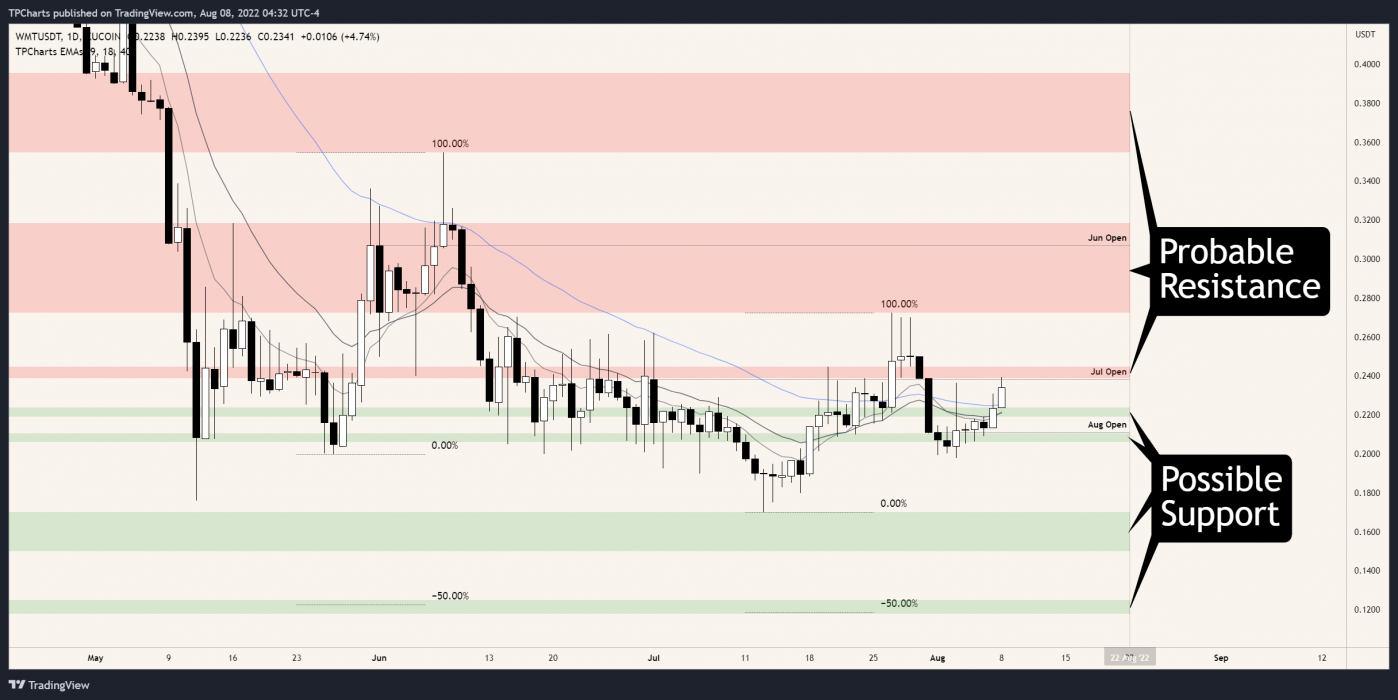
At the time of writing, WMT is ranked the 385th cryptocurrency globally and the current price is US$0.2242. Let’s take a look at the chart below for price analysis:

WMT has been consolidating since its 81% drop from March until mid-May.
Currently, it is challenging resistance near a zone of inefficient trading on the daily chart from $0.2448 to $0.2389. This zone is near the July monthly open.
The price may be reaching for swing highs near $0.2724. Above these highs, several pockets of inefficient trading on the daily chart could continue drawing the price upward between roughly $0.2724 and $0.3186. Bulls might remain cautious about entering longer trades until they reclaim the high of this zone.
On a reclaim of this zone, bulls might aim for the swing high near $0.3548. This level, up to $0.3956, shows inefficient trading on the monthly and weekly charts that the price may want to fill.
The 9, 18, and 40 EMAs converge near $0.2238. This area may also show inefficient trading on the daily chart after Monday’s close and could provide the closest support for a rally.
Slightly lower, an area from $0.2106 to $0.2060 might also provide support. It’s near the current swing’s initial accumulation on the daily chart and the high of accumulation on the weekly chart.
If this level breaks, it could signal a more significant drop. No historical price action exists under July 13th’s low, which may be the first target. Beyond this low, recent price swings’ 50% extensions align near $0.1250 and may provide the next downside targets.
Learn How to Trade Live!
Join Dave and The Crypto Den Crew and they’ll show you live on a webinar how to take your crypto trading to the next level.

Where to Buy or Trade Altcoins?
These coins have high liquidity on Binance Exchange, so that could help with trading on AUD/USDT/BTC pairs. And if you’re looking at buying and HODLing cryptos, then Swyftx Exchange is an easy-to-use popular choice in Australia.
Disclaimer:
The content and views expressed in the articles are those of the original authors own and are not necessarily the views of Crypto News. We do actively check all our content for accuracy to help protect our readers. This article content and links to external third-parties is included for information and entertainment purposes. It is not financial advice. Please do your own research before participating.
Credit: Source link


