Aave managed to break past its crucial resistance of $104 over the last 24 hours. As the market demonstrated strength, altcoins across the industry attempted to move north. Bitcoin climbed above the $30,000 price level and this extended gains across the altcoin market.
At the time of writing, Aave was still quite close to the $104 price level which now acts as a support. The bulls need to amplify in order for the bearish thesis to be invalidated. Over the last week, Aave gained about 10% on its chart. A current fall in price will push the coin below the $103 support line.
Right now the coin has been facing strong resistance at the $108 price level. For the coin to trade in a bullish price action, it is important for Aave to trade above the $108 resistance level. If the coin doesn’t manage to move above the aforementioned level then Aave might extend further losses.
Aave Price Analysis: One Day Chart
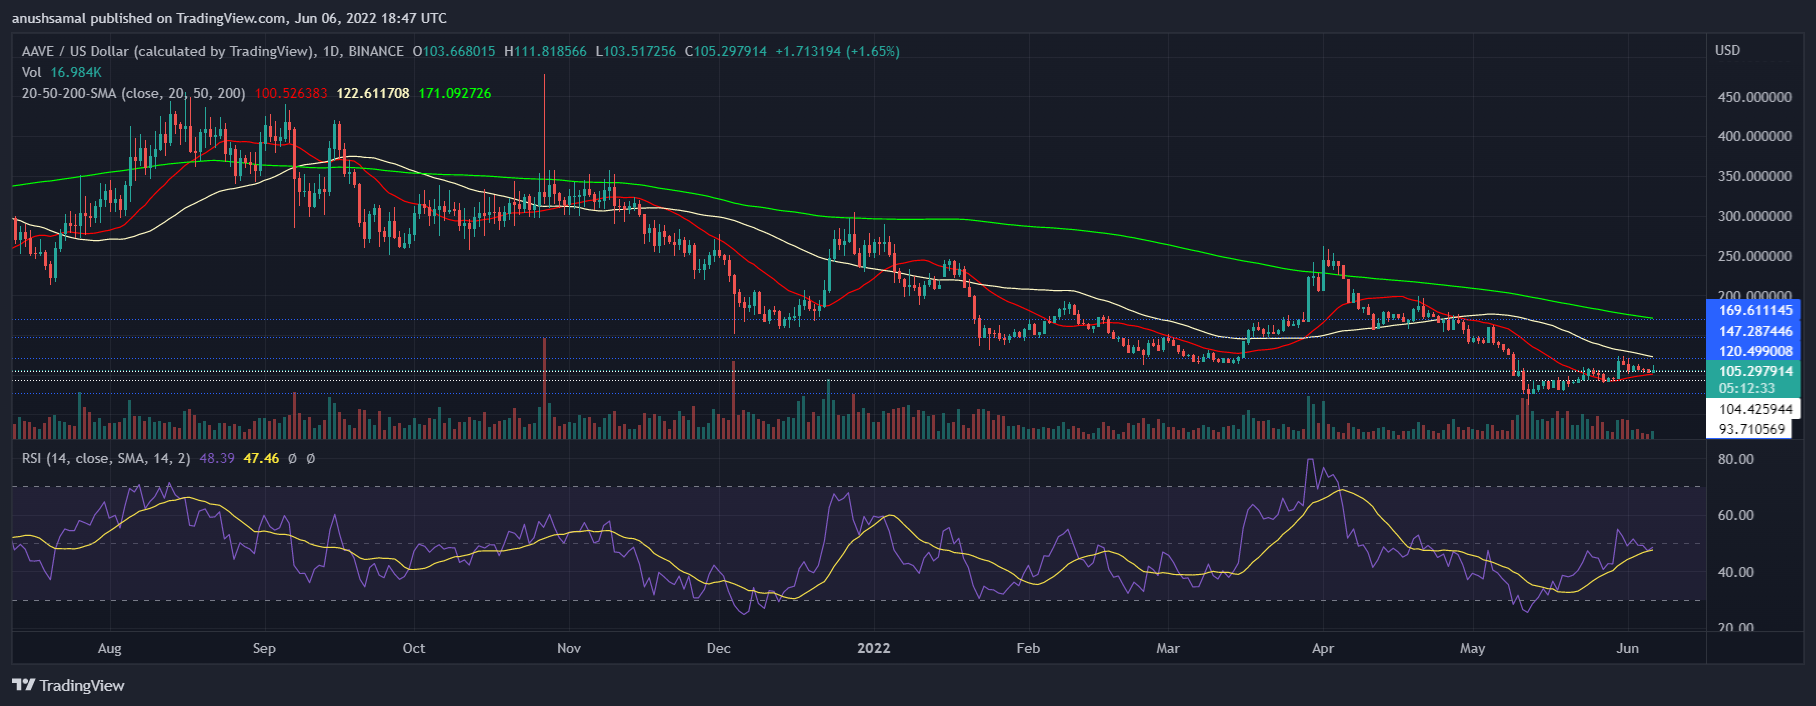
The altcoin was trading at $105 at the time of writing after breaking past the $104 resistance level. Overhead resistance for the coin stood at $108. A break below the current price level can push the coin to the $93 mark. The other major resistance mark stood at $120.
Aave last traded around this price level in the month of January 2021. Over the last one week however, buyers attempted to return to the market. The same reading was reflected on the volume bars. Volume traded in the last session was in the green. This indicated bullish price action at press time.
Technical Analysis

Over the past week as Aave continued to display strength, buying strength slowly mounted on the chart. The Relative Strength Index reflected the same. At the press time, the indicator was on the half-line, this reading meant that there were equal number of buyers and sellers in the market.
The price of Aave however was parked above the 20-SMA line which indicated that the price action was more inclined to favour the buyers. The buyers were responsible in driving the price momentum in the market.
Related Reading | Aave Below Its Long Term Support; What To Expect Now?

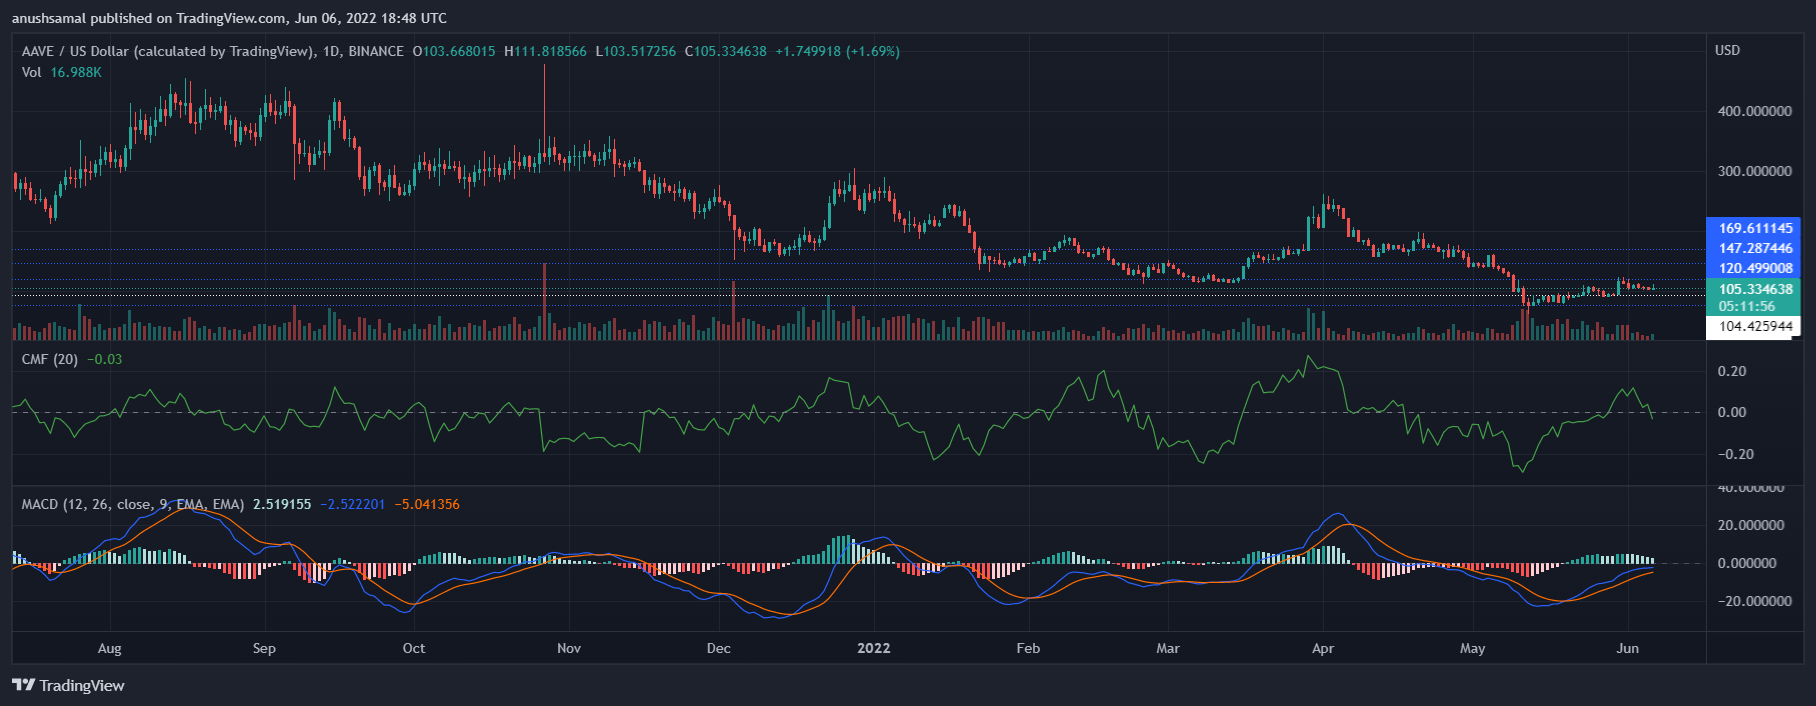
The coin so far has painted mixed signals on the one day chart. Although most indicators swayed towards bullishness, some were yet to reflect the same price action. The Chaikin Money Flow registered a downtick, this signified a fall in capital inflows over outflows.
On the other side, Moving Average Convergence Divergence underwent a bullish crossover as price of the coin started to look optimistic. The green histograms on the MACD were also indicative of the buy signal. If buyers act on it then Aave can even attempt to trade near the $120 price mark, however, support from broader market will be required.
Related Reading | Bitcoin Bullish Signal: 1k-10k BTC Holders Have Been Buying Recently
Credit: Source link


