Welcome to this weekly series from the TradeRoom. My name is Dave and I’m the founder of The Crypto Den, an Australian-based crypto trading and education community aiming to give you the knowledge to take your trading game to the next level.
In this article:
- Crypto Market Outlook
- Last Week’s Performance
- This Week’s Trades
Crypto Market Outlook
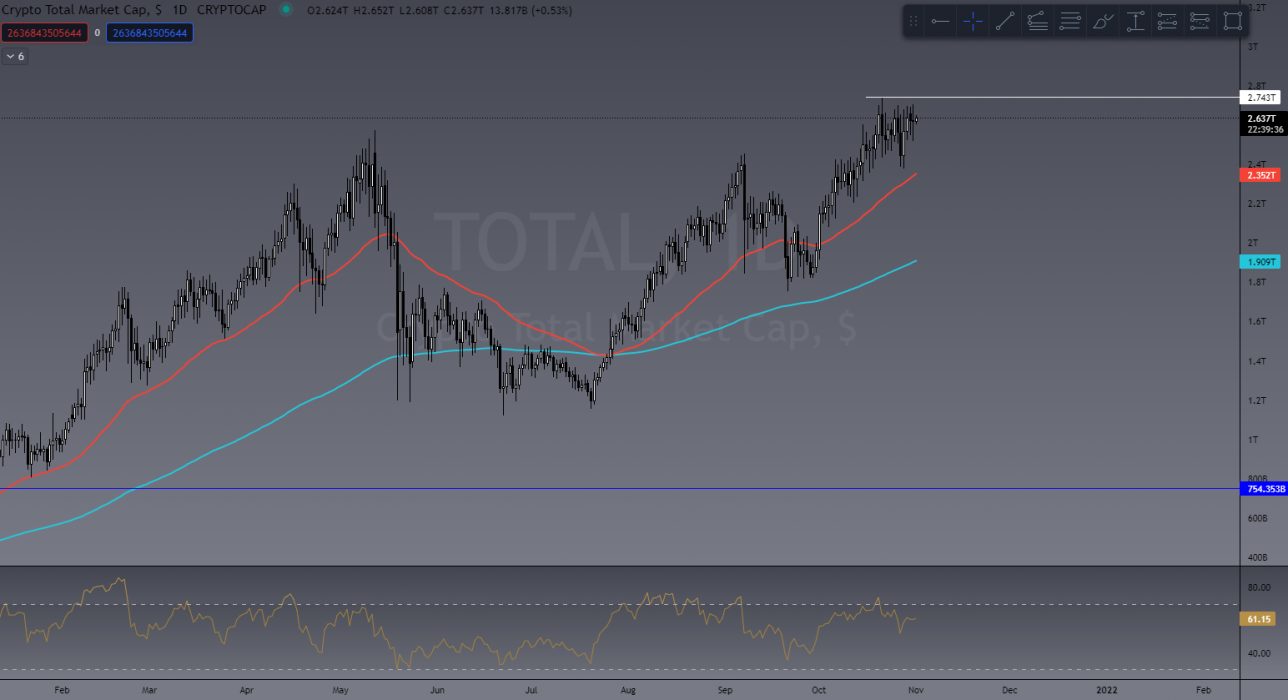
Despite BTC dropping 14% from its new all time high (ATH) last week the entire Crypto Market Cap (TOTAL) still looks very healthy sitting at US$2.64 Trillion area. Which is only a 4% drop since the new ATH of the market cap.
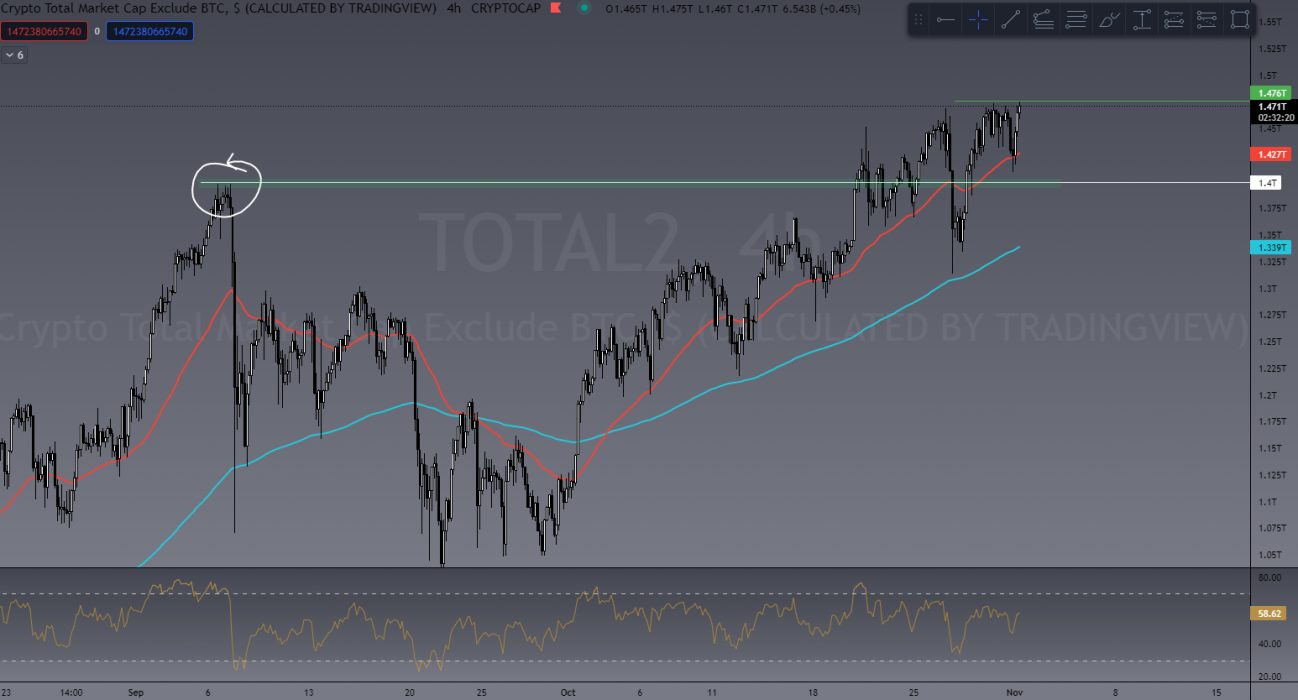
What we find really encouraging is the current position of the ALT coin market (TOTAL2) which has a total value of US$1.47 Trillion. Reaching new highs yet again this is extremely bullish, not just for ALTS, but show for BTC as well as its showing strong confidence in the overall market. Bitcoin Dominance (BTC.D) dropped with BTC recently and ALTS only seen rather minor reactions to this drop.
Even the total crypto cap excluding both BTC and ETH (TOTAL3) has reached new highs this week topping out at US$963 Billion. Which tells us that a lot of capital is confidently flowing into ALTS across the board and not just to the Crypto #2 Ethereum.
Now lets take a good look at Bitcoin.
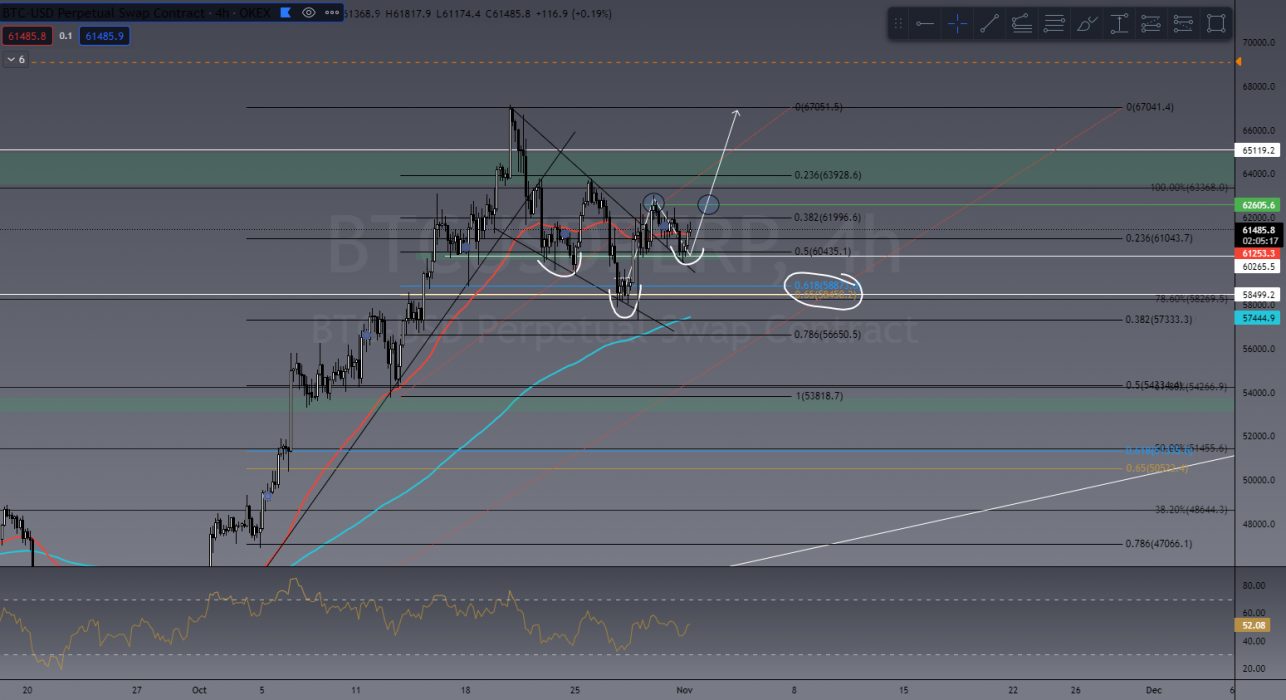
BTC pulled back to find daily support at US$57,500 after reaching a new ATH at US$67,000. We thought we would see a much stronger initial push high from BTC after achieving a new high however a pullback like this is NOT unhealthy. In fact quite the opposite.
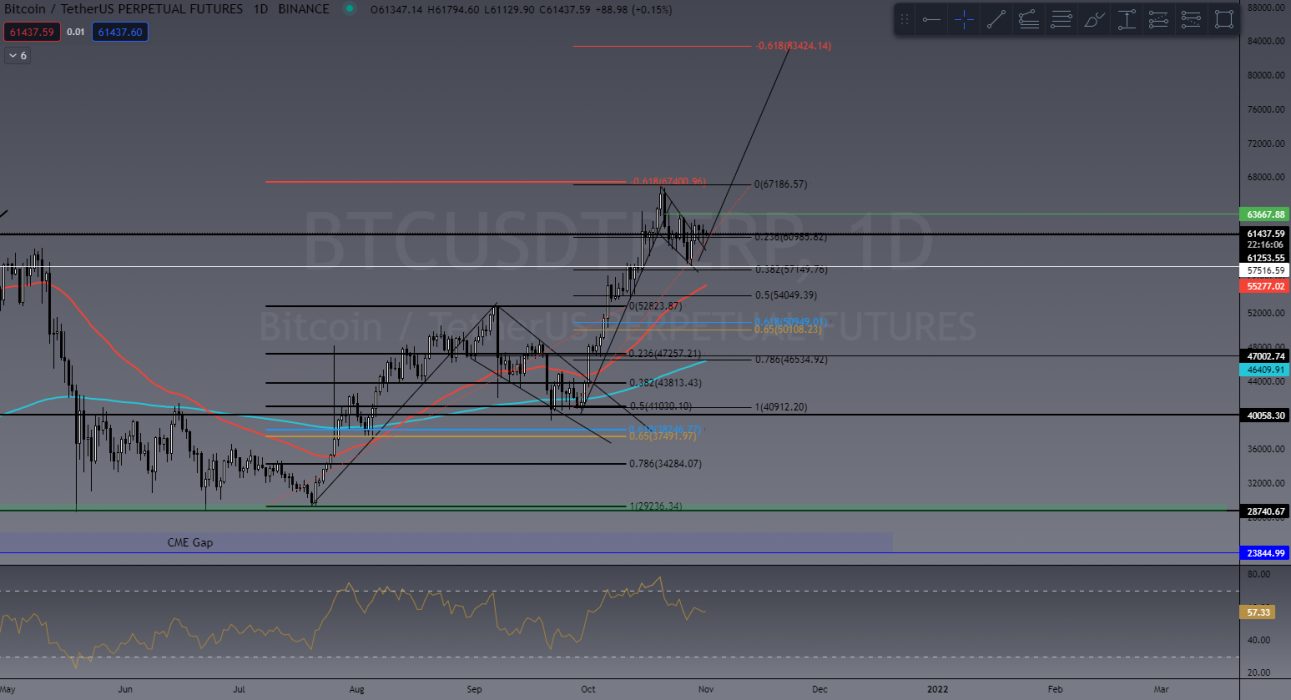
BTC could simply be painting a daily bullflag! This is a bullish trend continuation pattern which shows a price projection (length of the flag pole) lining up perfectly to a future 618 Fibonacci level. We teach you all about chart patterns and Fibonacci in our Trading Course if you’d like to learn more on this!
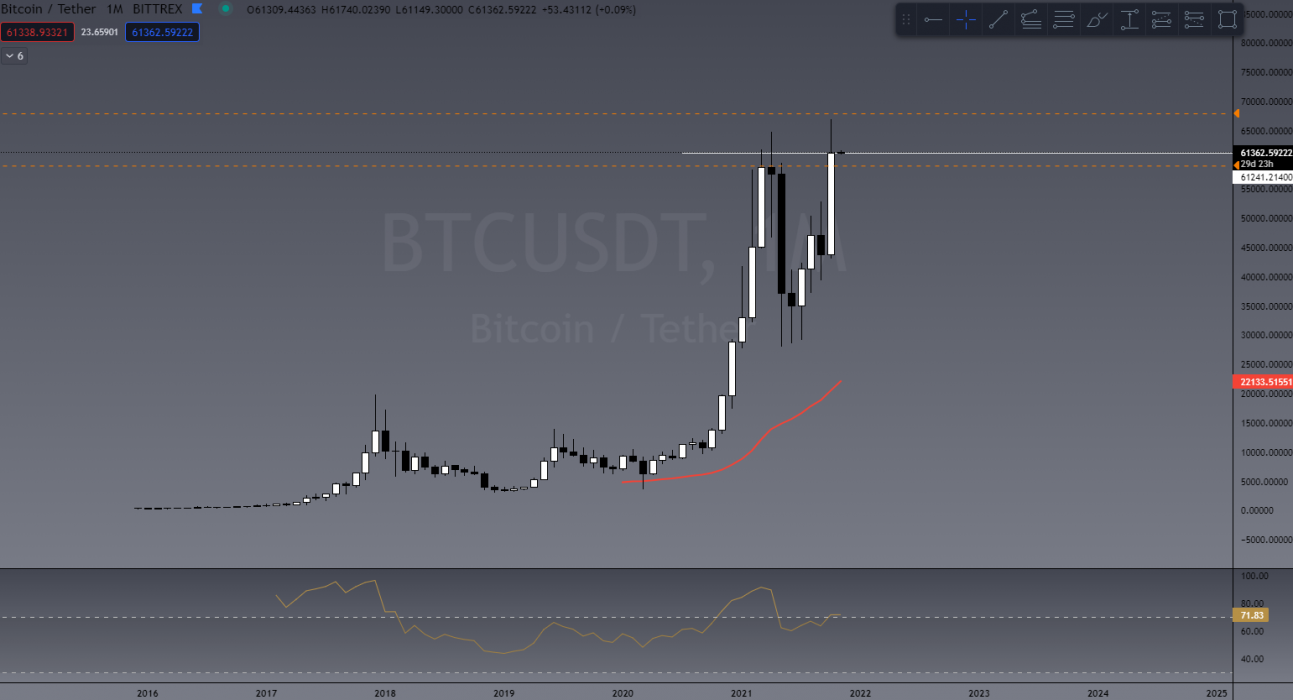
If we take a look at BTC on a monthly chart you’ll see its just had its highest monthly close ever! Another very bullish sign.
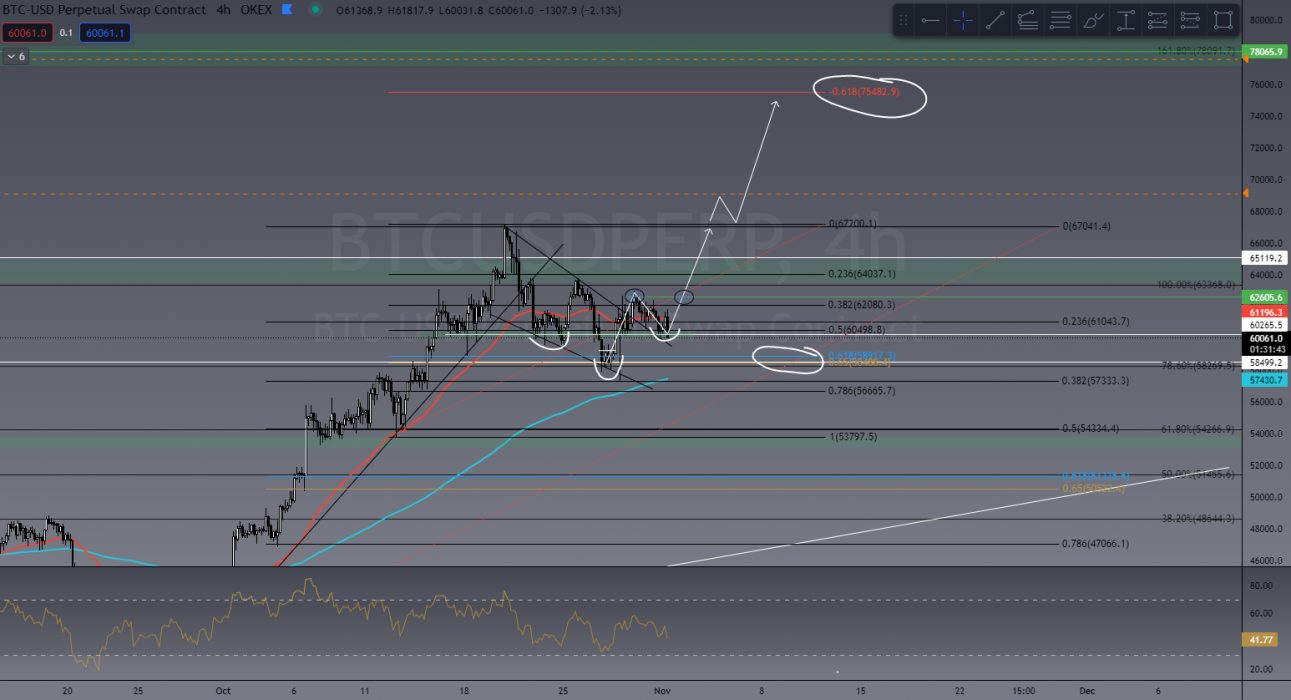
So what are we looking for in the TradeRoom next? Based on a 4 hour chart it shows BTC breaking out of the bull flag and retesting a level of both horizontal support and the local down trend. This restest forms a higher low (HL) which leads some pattern traders to see an inverse head and shoulders pattern (iH&S) which is a common reversal pattern preceding a recent trend down. The “head” also reached the common Fib retrace level of 61.8%. We are waiting to see a confirmation of this by breaking above US$62,605 (green line/circles). Once this is confirmed I see BTC approaching the new ATH with bullish strength behind it!
Overall market sentiment is high. The general consensus is that we will see the entire market make another move up. Be sure to mitigate any risk by ensuring stop losses are in place!
Last Week’s Performance
SOL/USDT
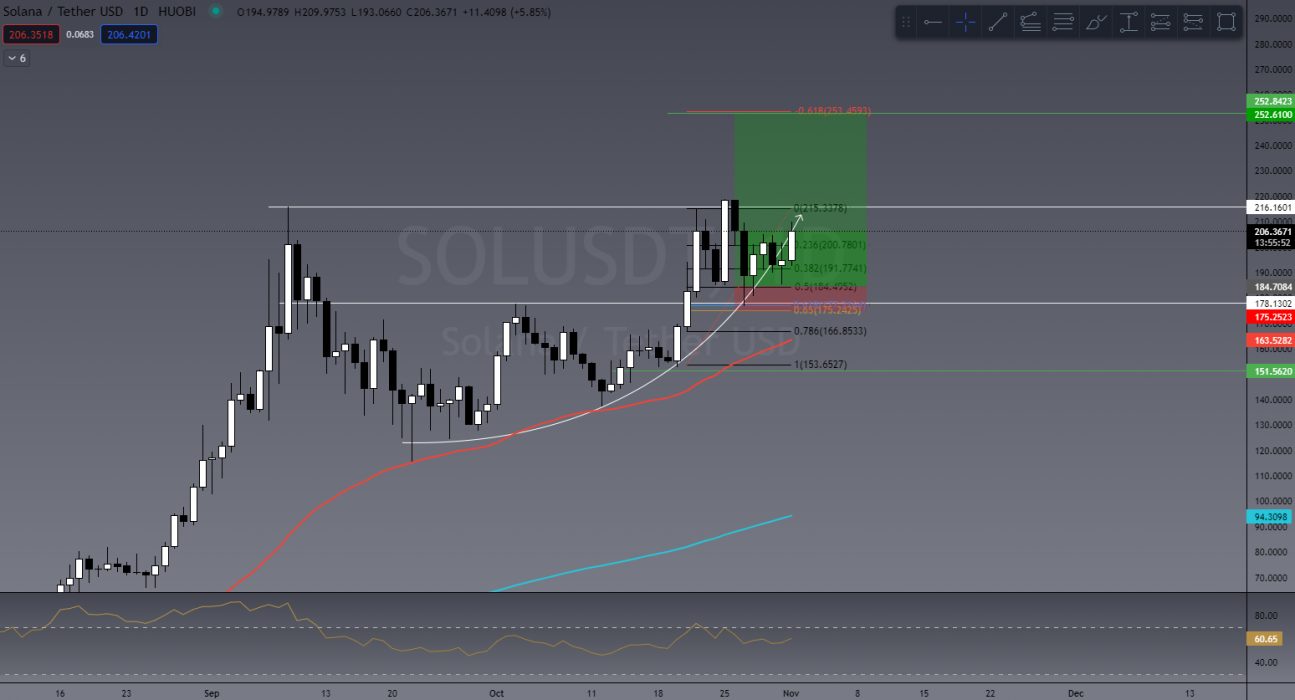
In my last article I touched on SOL being one of the key coins to watch. Even with BTC dropping that 14% I’m so impressed with how well SOL has held its own. Making a higher high (HH) on daily chart we still expect to see SOL reach new highs at around US$250
ETH/USD
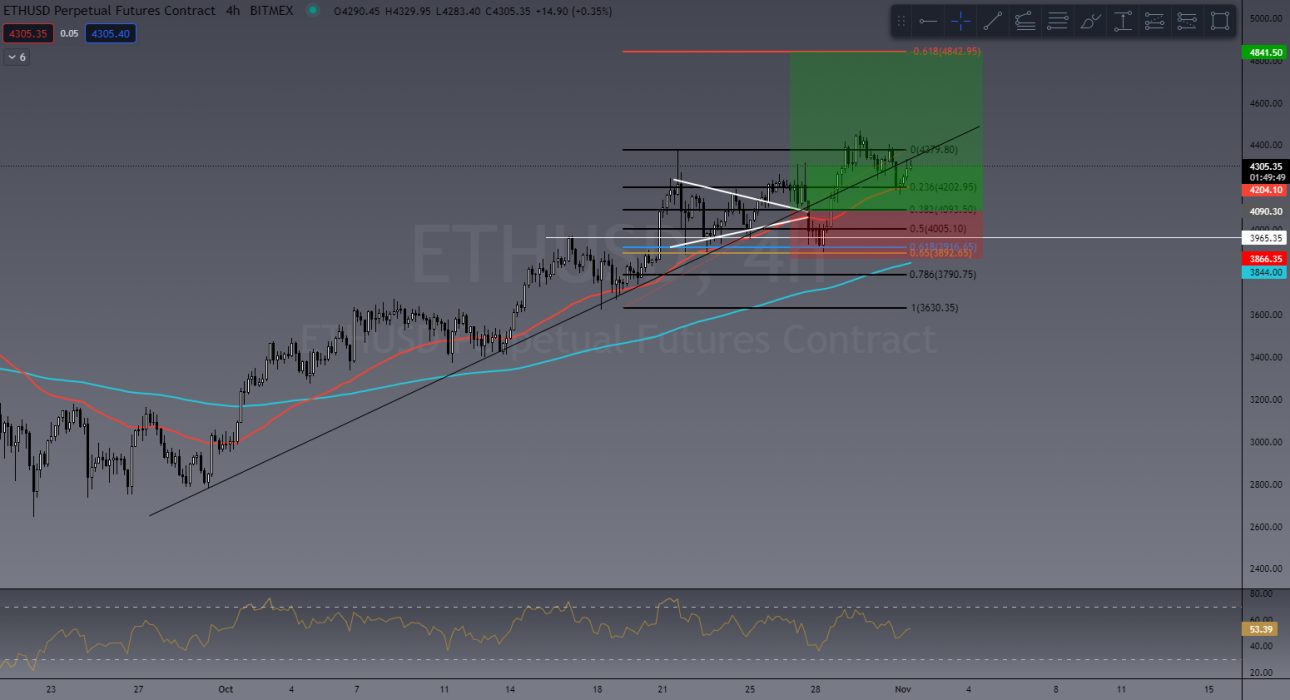
We also looked at ETH for a long position. As you can see in the chart below this trade was ALMOST stopped out when BTC pulled back however it wasn’t hit and we are still in the trade. Again, I’m expecting to see ETH hit close to US$5,000 soon!
MANA/USDT
This trade was by one our our TradeRoom members and former students! Using Fibonacci as a project tool this trade played out better than expected!
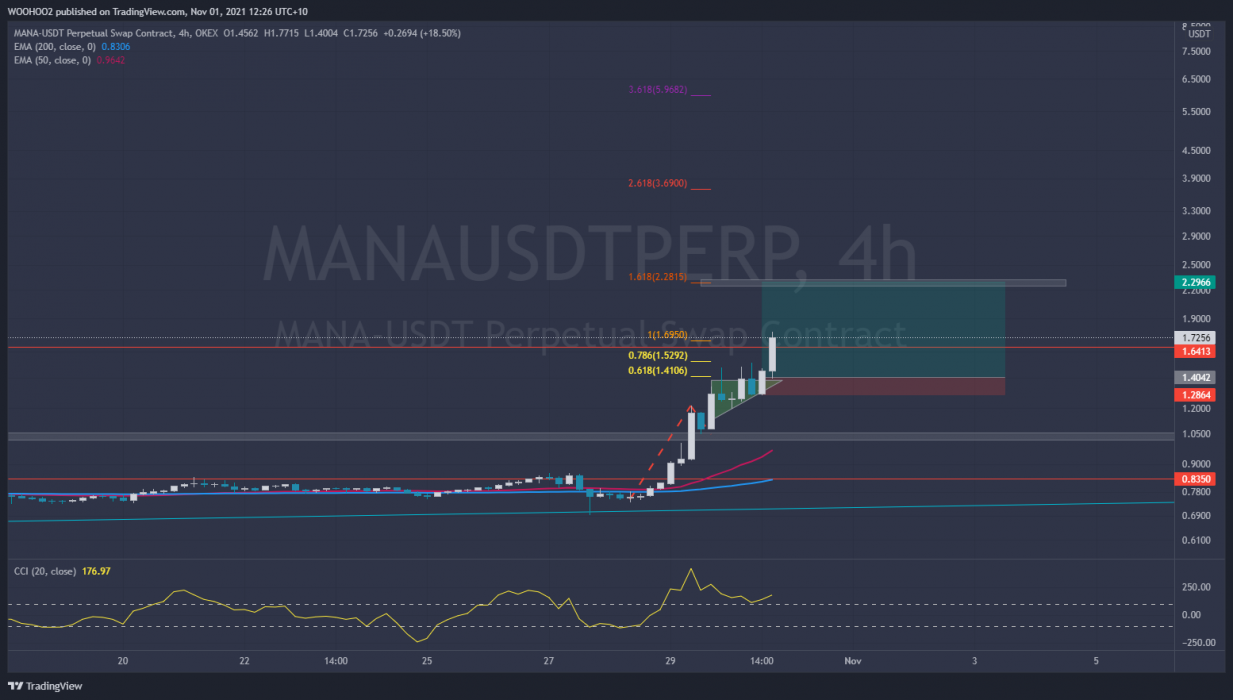
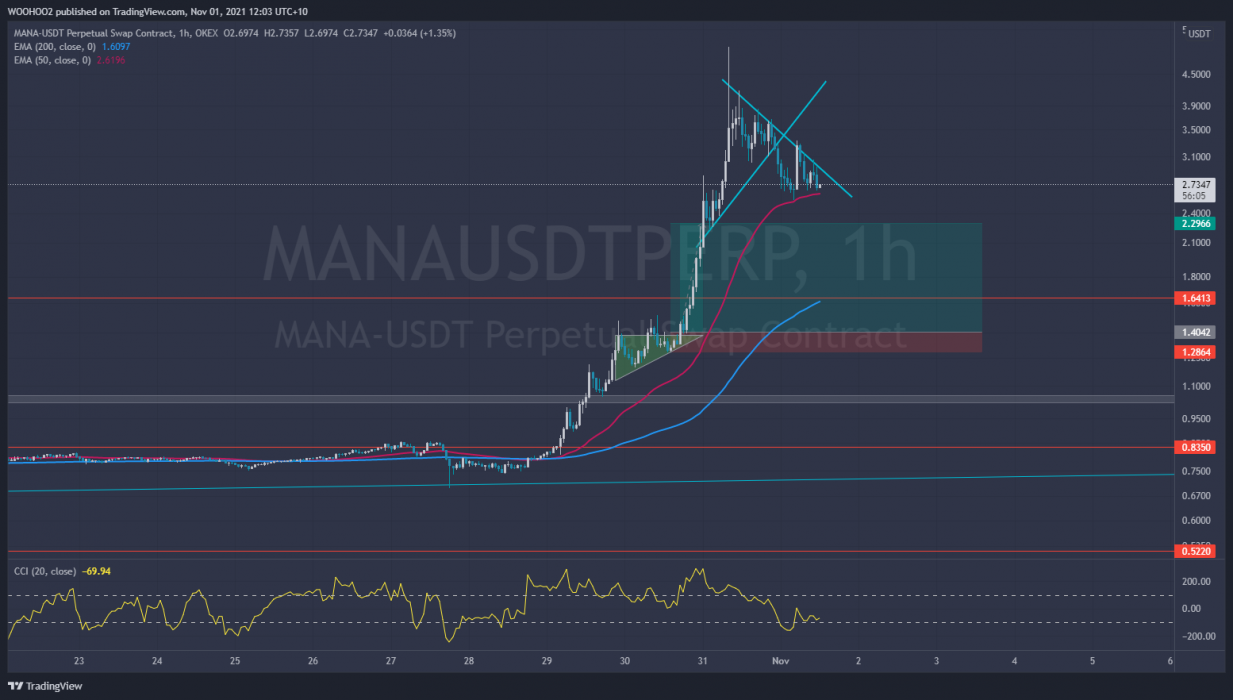
‘Dazzling’ as he’s known in the TradeRoom spotted this ascending triangle pattern (another bullish continuation pattern). After entering MANA did a massive 240% move. Daz entered into a leveraged trade yielding him over 1000% which is amazing! I’m sure everyone reading this from the TradeRoom can agree Daz is a TCD legend and always extremely helpful and supportive within the community! Nice work Daz!
NOTE: Daz has been trained to trade with leverage. Leverage trading should NOT be done by beginners. If you’d like to learn our Trading Fundamentals LIVE course starts in 2 weeks!
This Week’s Trades
BTC/USD
Lets look at BTC first. Can it follow the potential path addressed above and breaks the ATH at US$67,000 we will likely see US$75,000 – US$78,000 as a first target.
ALGO/USDT
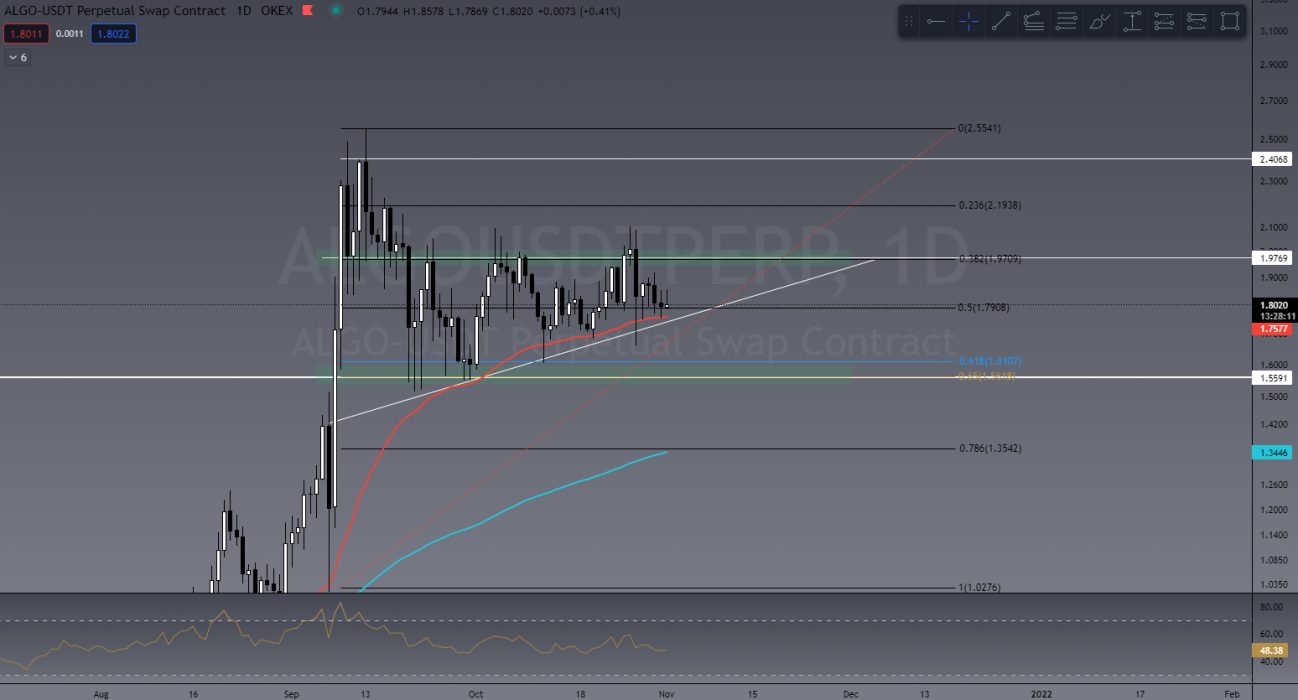
An ALT showing some signs of strength amid the BTC pullback and one of the fan favourites in TradeRoom is ALGO.
Showing some daily Higher Lows (HL) with equal highs ALGO is one to watch this next week or so.
AXS/USDT
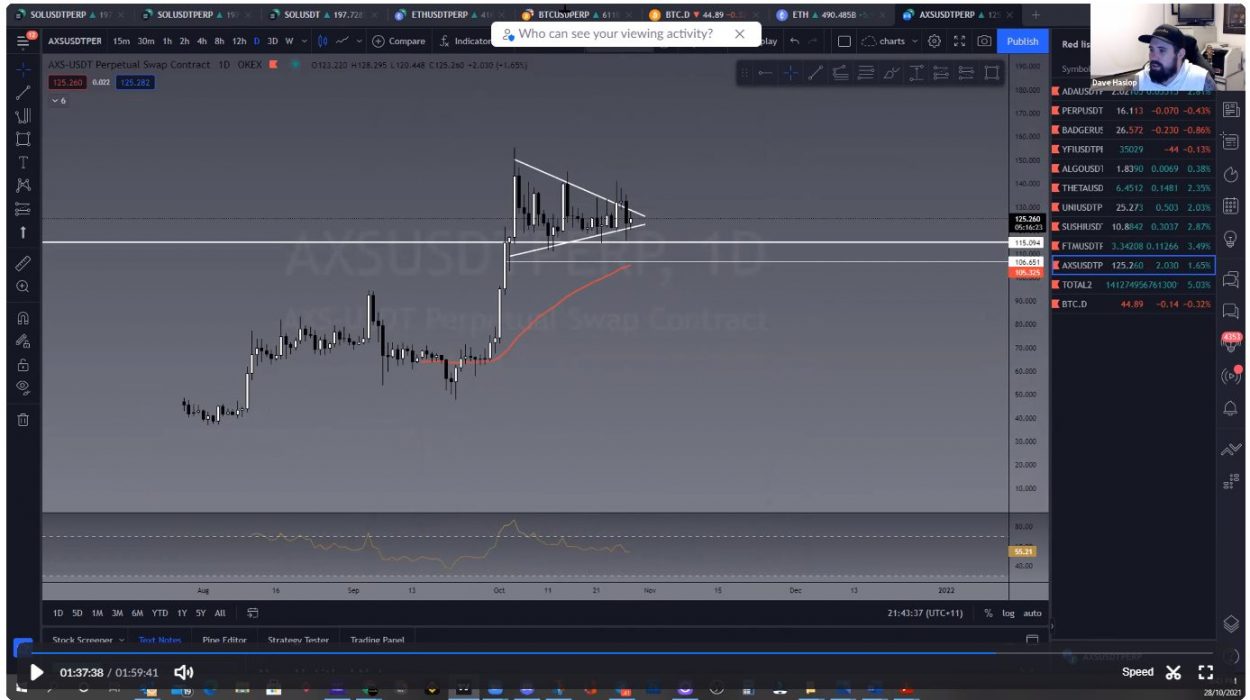
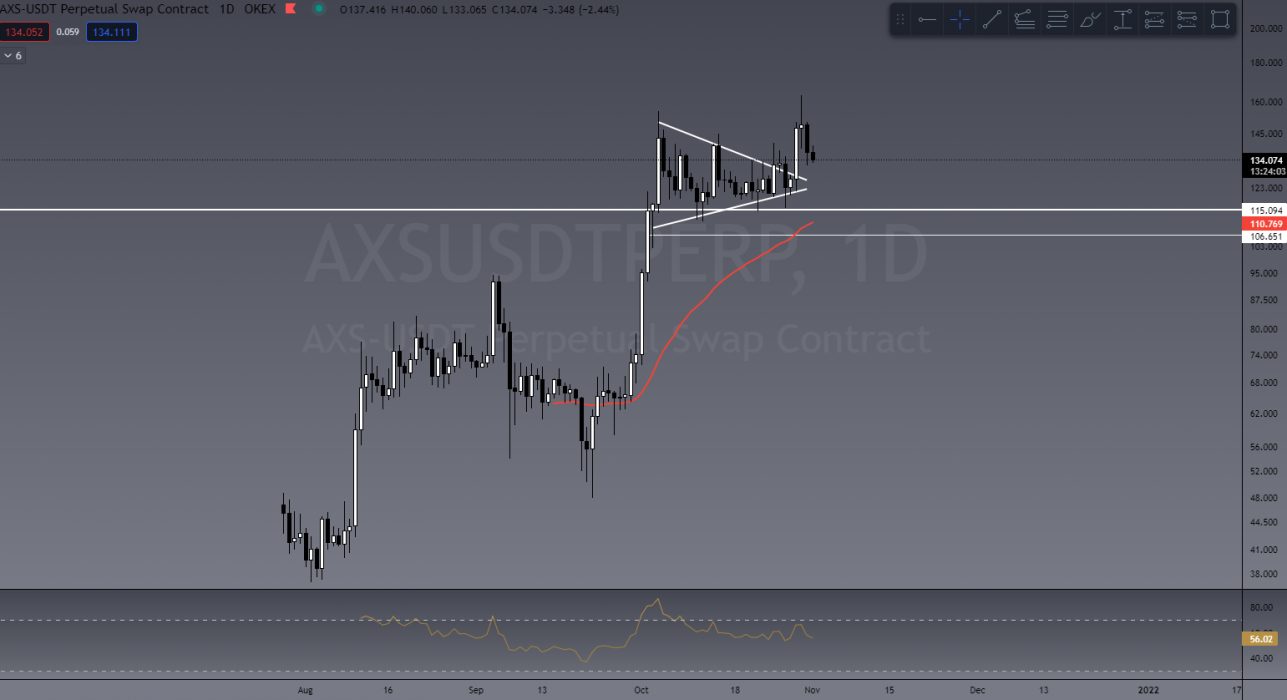
AXS is one we touched on in our market scan last Thursday as its be painting a daily symmetrical triangle. Again this shows good strength against BTC. AXS has since broken out and already achieved a 34% increase. Currently pulling back to test support and could present opportunity for a new entry.
Its important to remember that when trading ALT coins, their price action is heavily dependent on BTC. If BTC takes a bullish path ALTS will likely follow. If BTC turns bearish then ALTS will likely dump in price even harder!
If you would like to become a better trader, you are invited to join our TradeRoom where we share daily charts and market analysis. In our community we strongly encourage and teach correct risk management strategies to keep our members safe in this new volatile crypto market.
>> Take our Free Beginners’ Trading Course
>> Join our Trading Community for your 7 day free trial

The Crypto Den was created in 2017 to help the rapidly growing crypto community learn and understand the fundamentals of digital currencies and how to trade them.
Since then we have taught thousands of members the basics of technical analysis and trading strategies to further progress and perfect their trading abilities.
In the TradeRoom you will be included in a supportive environment which encourages personal growth, education and community support.
It’s a place to share your trading ideas and follow other experienced traders’ feeds to help keep your finger on the pulse of such a volatile market!
Disclaimer:
The content and views expressed in the articles are those of the original authors own and are not necessarily the views of Crypto News. We do actively check all our content for accuracy to help protect our readers. This article content and links to external third-parties is included for information and entertainment purposes. It is not financial advice. Please do your own research before participating.
Credit: Source link


