Welcome to this weekly series from the TradeRoom. My name is Dave and I’m the founder of The Crypto Den, an Australian based crypto trading and education community aiming to give you the knowledge to take your trading game to the next level.
In this article:
- Crypto Market Outlook
- Last Week’s Performance
- This Week’s Trades
Crypto Market Outlook
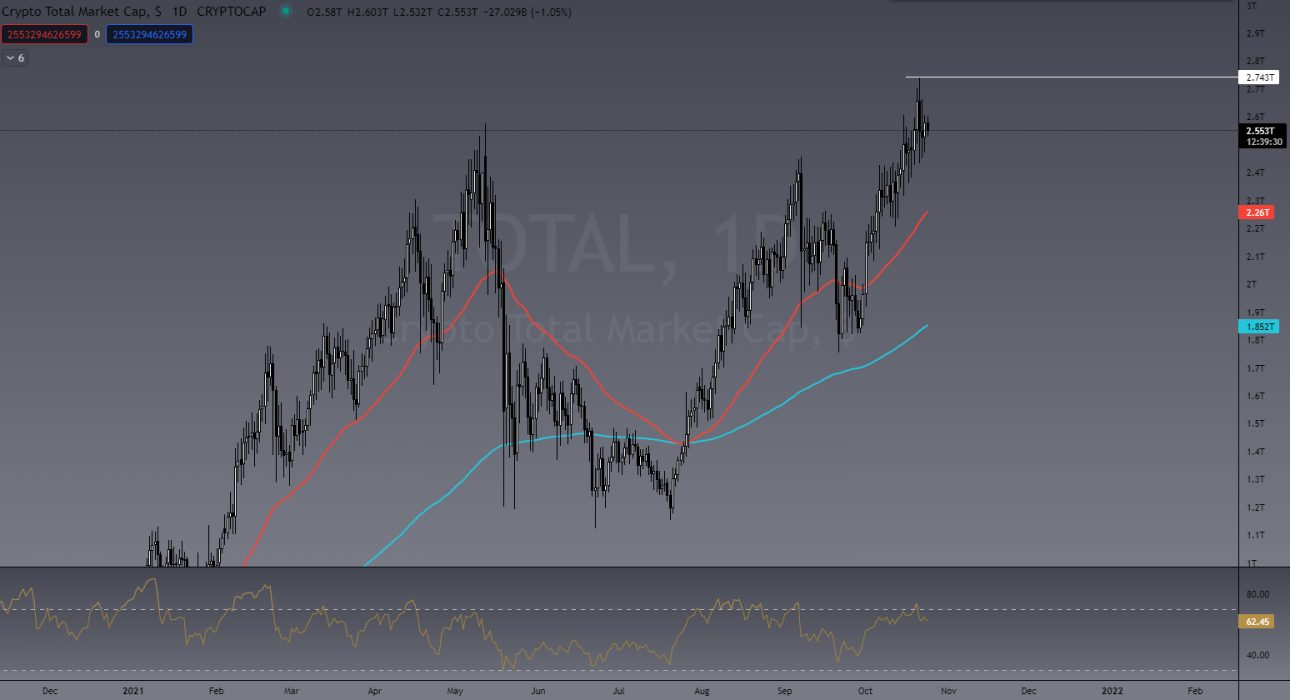
The entire crypto market cap peaked to a new all-time high (ATH) at US$2.7 trillion last week, showing strong confidence in the market. Prices are taken from Binance exchange.
Bitcoin itself reached a new ATH of US$67,000 after clearing the previous high of US$64,900. Despite having a daily candle close above the previous ATH, bitcoin has pulled back below for the last four days, finding support at US$59,500, which has previously proved to be a key level of support/resistance.
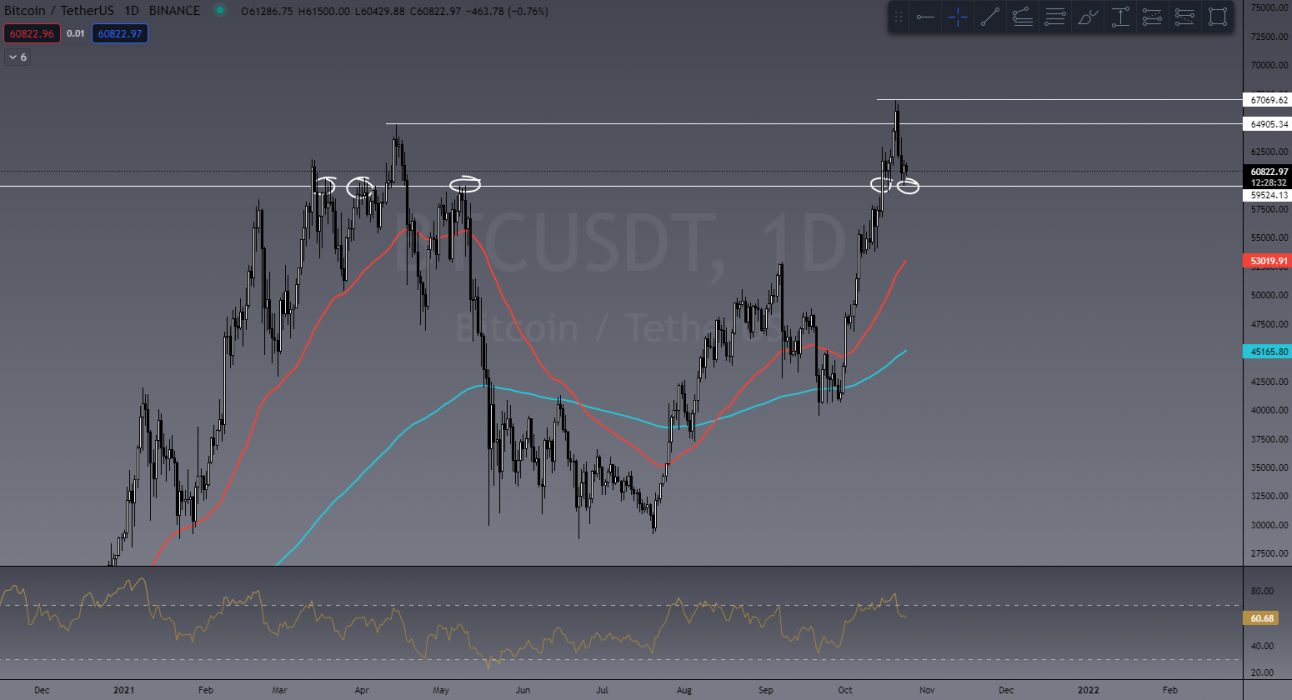
If this key level of BTC support holds, we are expecting to see some more bullish action with an initial target of US$78,000. I have outlined the reasons I believe this to be a good target in a separate blog post. If this price level were to break below and close, we could see a decent pullback to the US$53,000 zone, which will likely bring ALTS with it.
Why have we picked US$53k as a bearish target for BTC? You’ll see in the image below we have a confluence of strong daily support: the 50EMA and 50% Fibonacci level in bull runs, a 50% retrace can be typical. For beginners to technical chart analysis, we’ve got your back and teach how to use these tools to plot your own trades in our Trading Fundamentals Course available on The Crypto Den website.
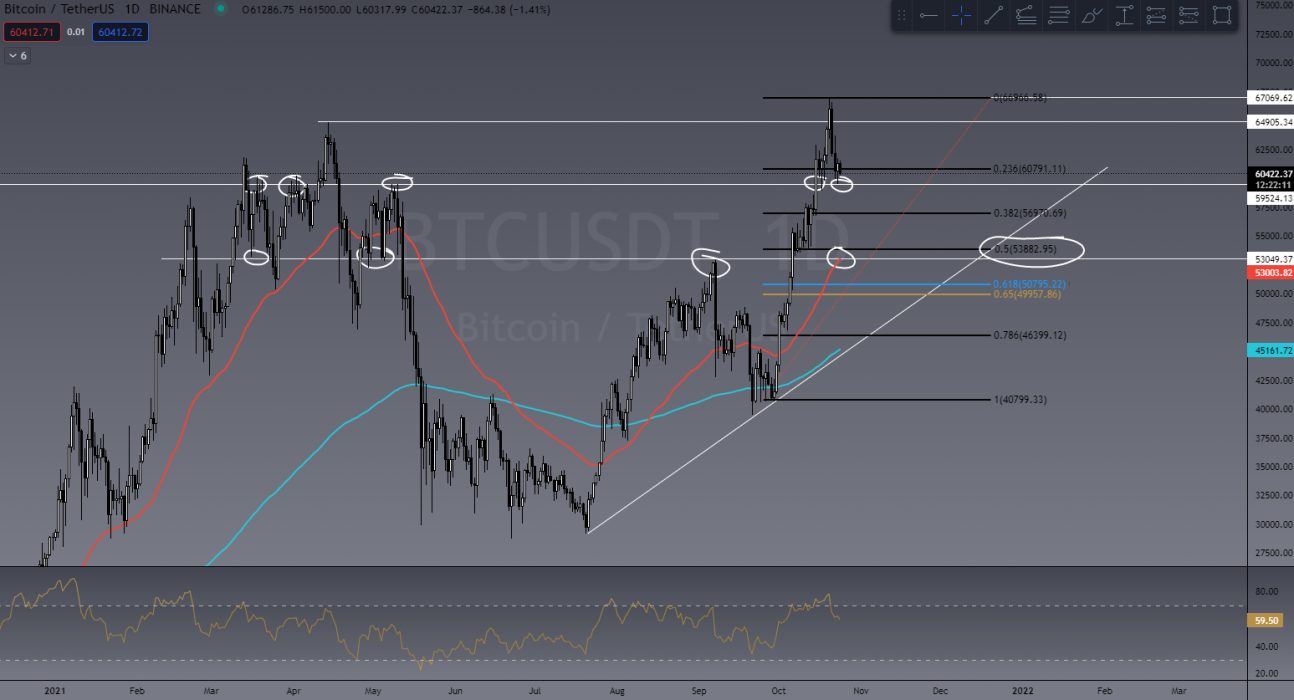
Ultimately in our TradeRoom, the general consensus is that we still hold a bullish bias with BTC. However, as traders we must adapt and move with the market, and have a trade plan for both scenarios of an up and down market.
In our courses and live lessons, we teach people to use the correct risk management strategies to have a plan in place no matter the direction the market takes.
Last Week’s Performance
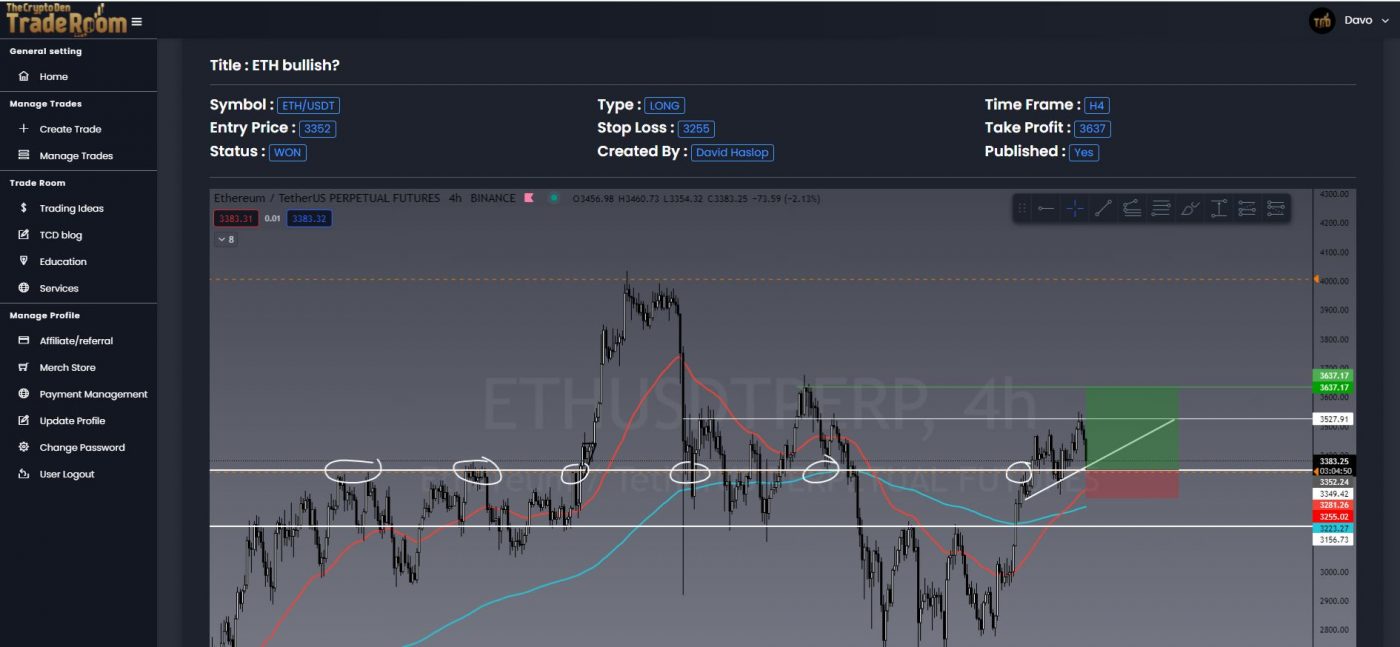
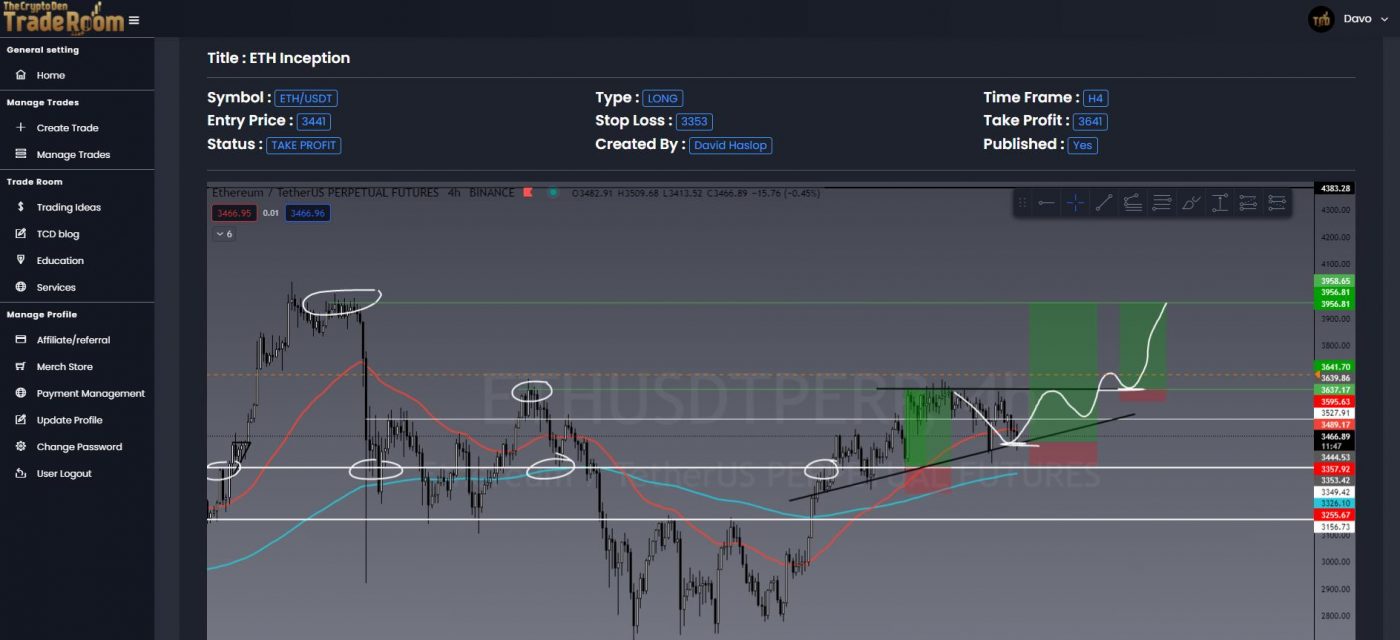
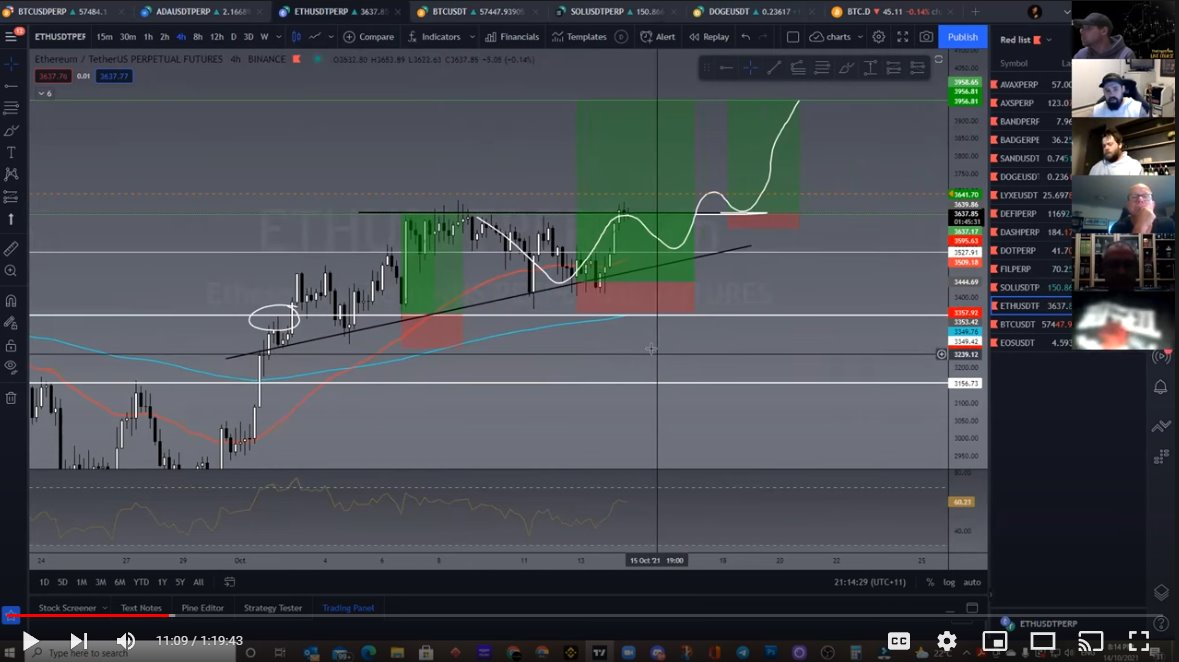
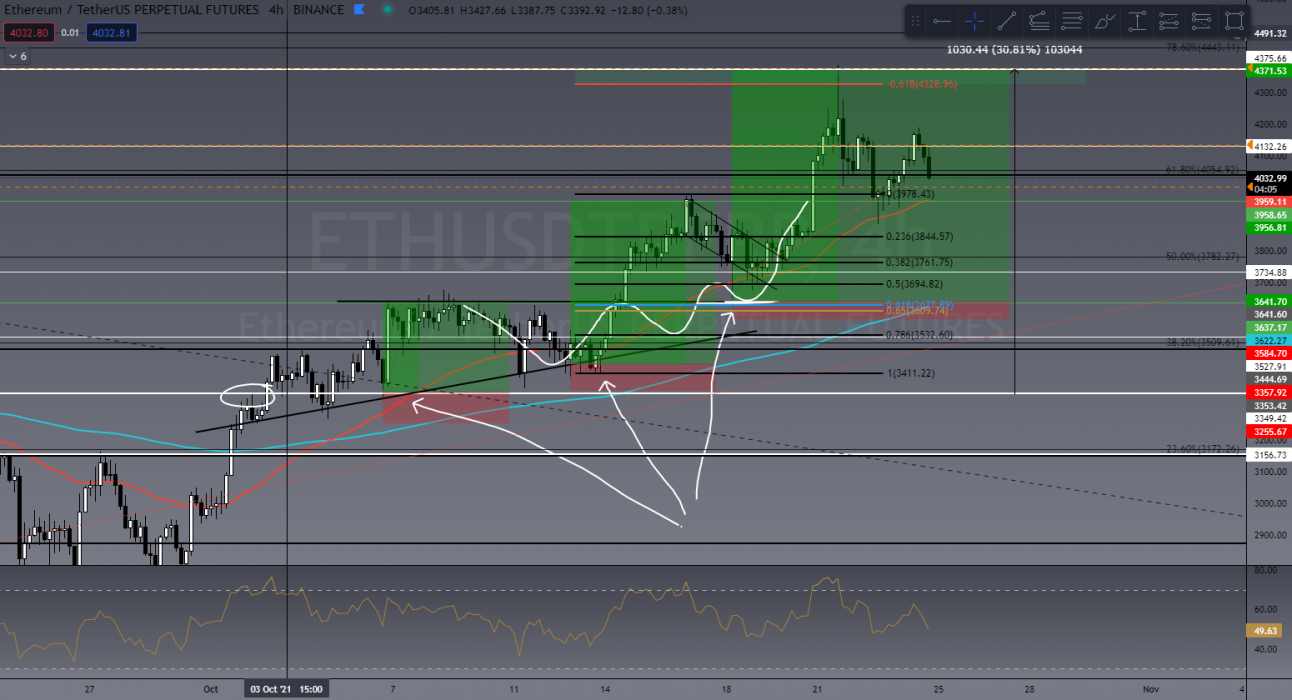
Last week in TradeRoom there were three trades we entered for Ethereum (ETH), as it tested its previous ATH showing some bullish signals in the charts. Some of the trades we made were successful and saw profit up to 500%, using staggering buy positions.
We discussed in our community that taking profits and also leaving some capital to ride through was the best strategy for this one, our members have used this strategy before to great success.
See our entries and exits below:
Trade #1: ETH/USDT
Trade #2: SOL/USDT
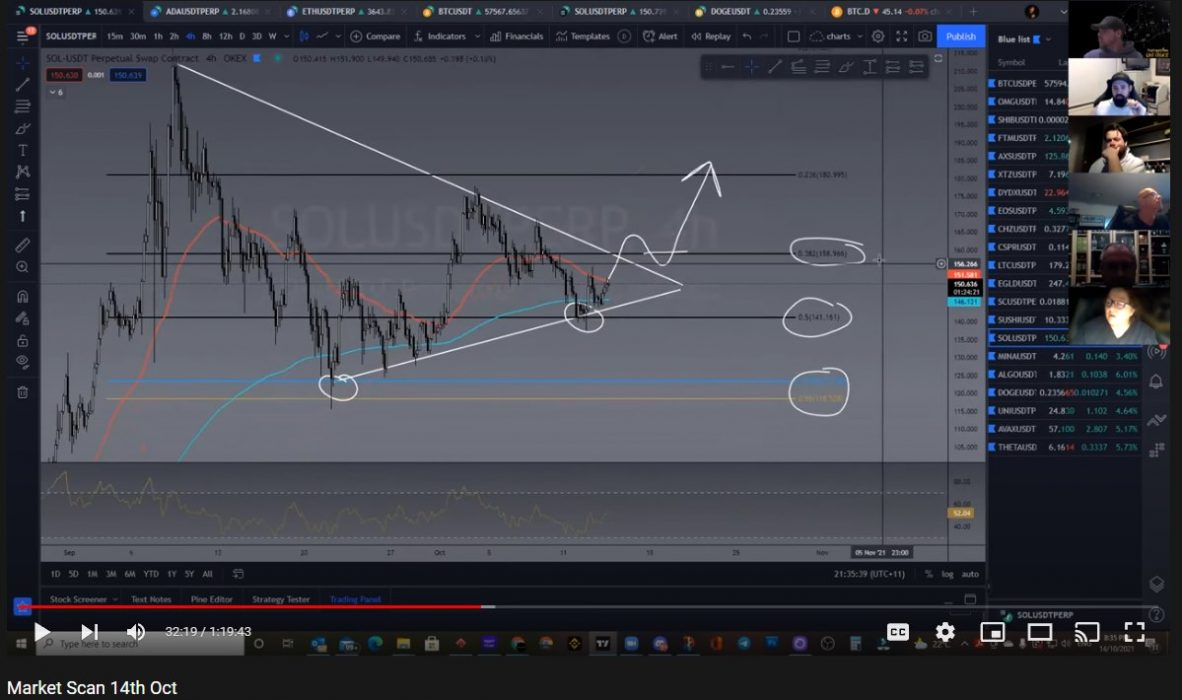
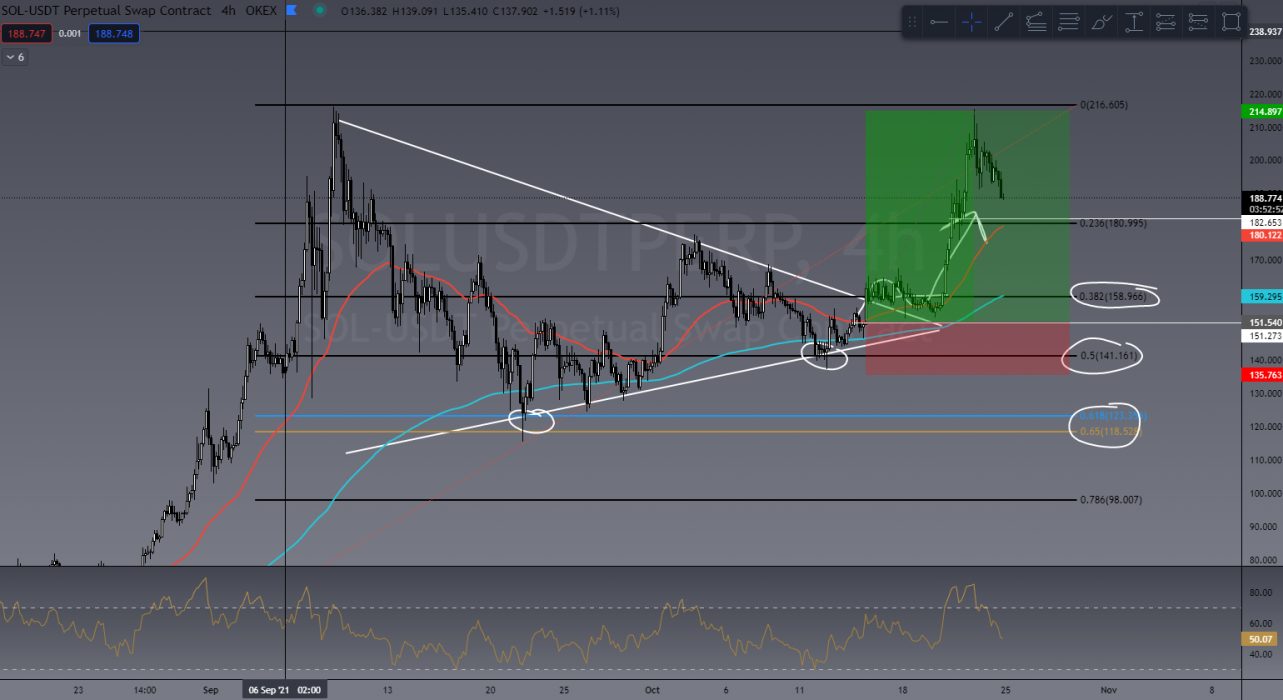
The next trade was one of our community favourites, Solana (SOL). In our TradeRoom live market scan on October 14, I drew a chart live with our members showing my plan for entering a new SOL trade. A week later, luckily, this trade went to plan and saw a profit up to 700%!
I love these live market scans as we can discuss the trades as a group and learn together We are stronger together!
This Week’s Trades
As most weeks, our market outlook ultimately depends on how BTC opens after the weekend. As mentioned previously, we are currently sitting on a solid level of support, however if BTC breaks below this level, we’ll be either catching a retest for a counter-trend short or waiting for US$59k to hit to enter a long position.
BTC/USDT
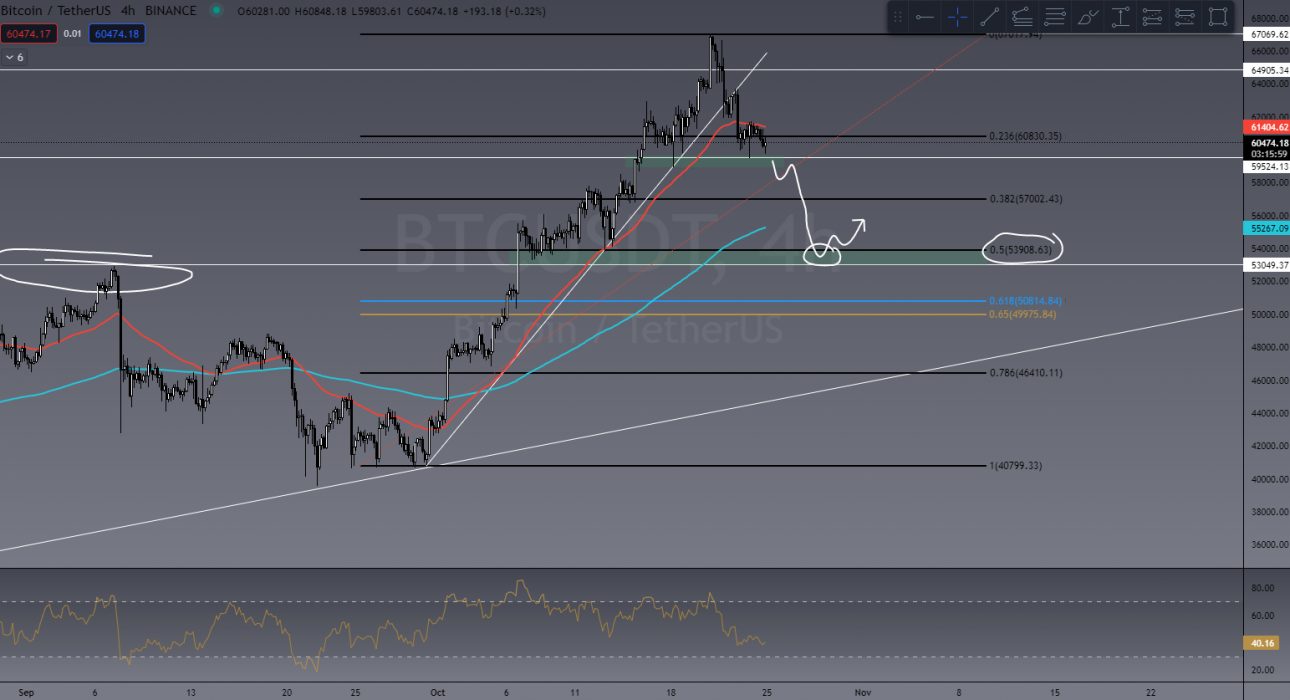
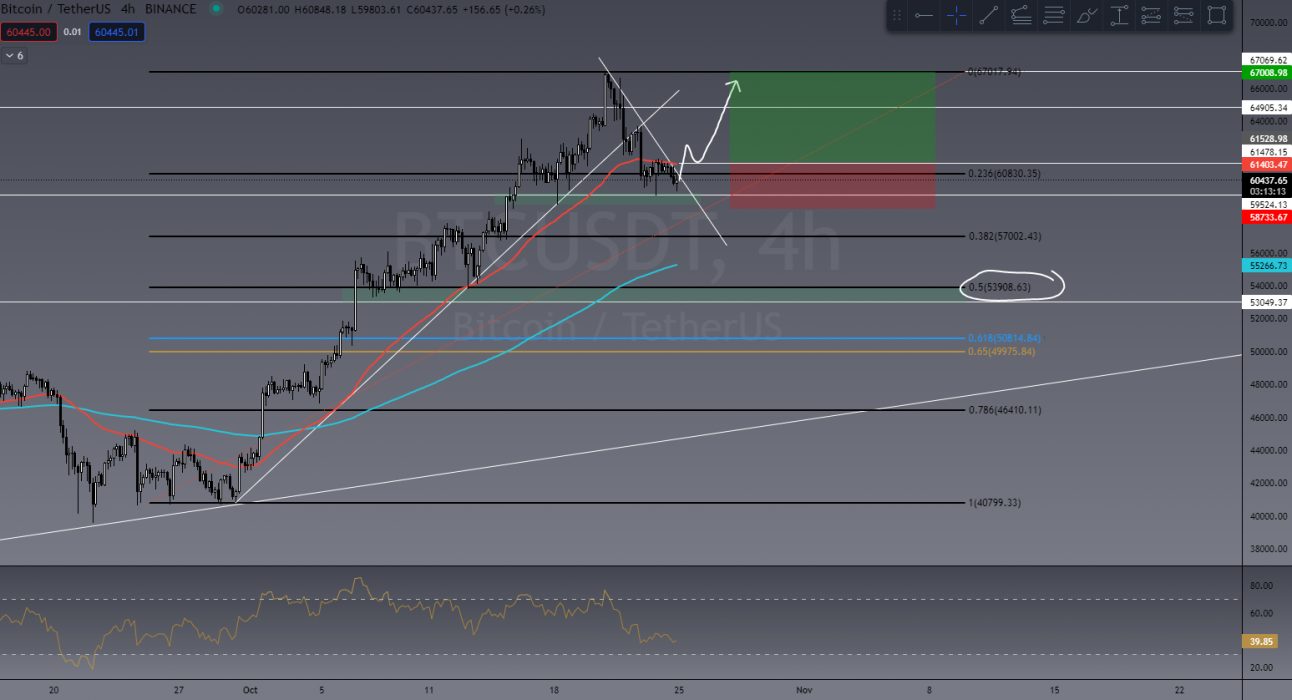
What we’re looking for at the current price level is solid candlestick analysis. We want to see a bullish engulfing candle causing a breakout of the local downtrend BTC has been in for the last four days and retest the 50EMA as support for an entry.
ETH/USDT
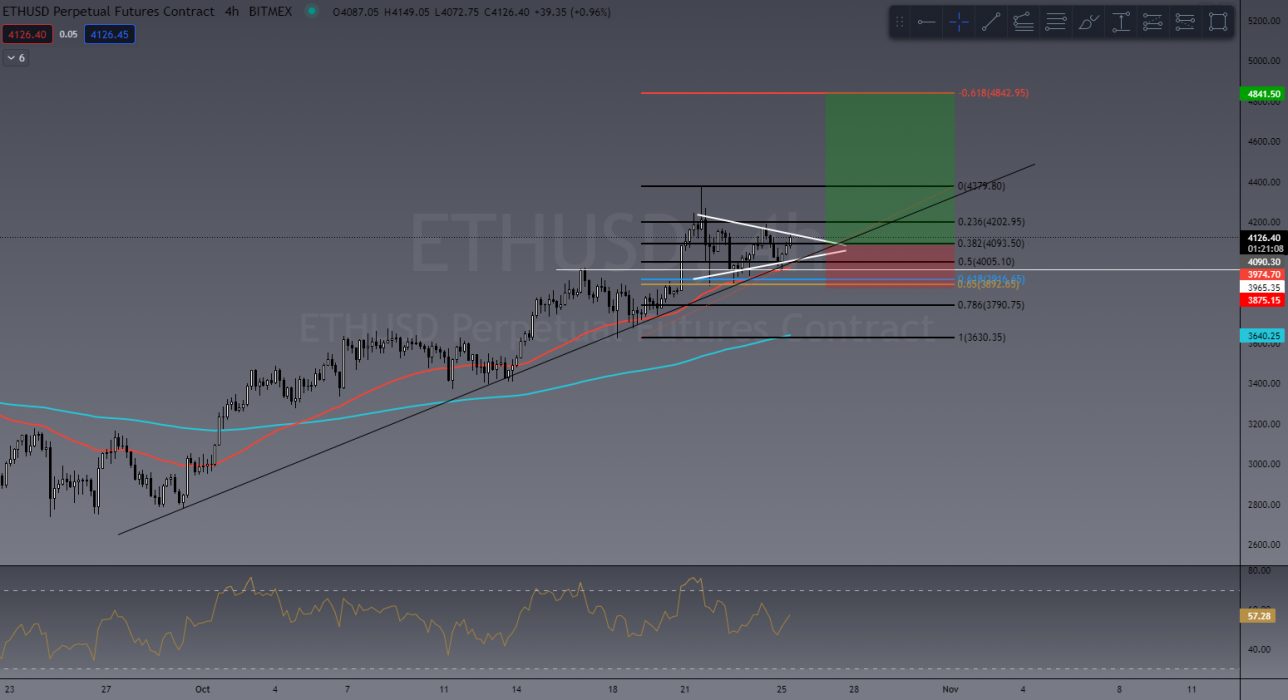
One of the biggest movers this week could definitely be ETH as the charts suggest. As outlined above in last weeks trades, ETH has performed extremely well lately and we see no reason for that momentum to slow just yet.
In the TradeRoom we are currently watching this symmetrical Triangle having tested the Fib golden pocket (a key retrace level of 61.8% – 65%). A break out to the upside here could very well see ETH on the path to a new ATH of US$5,000! Tune in next week to see if it happens!
SOL/USDT
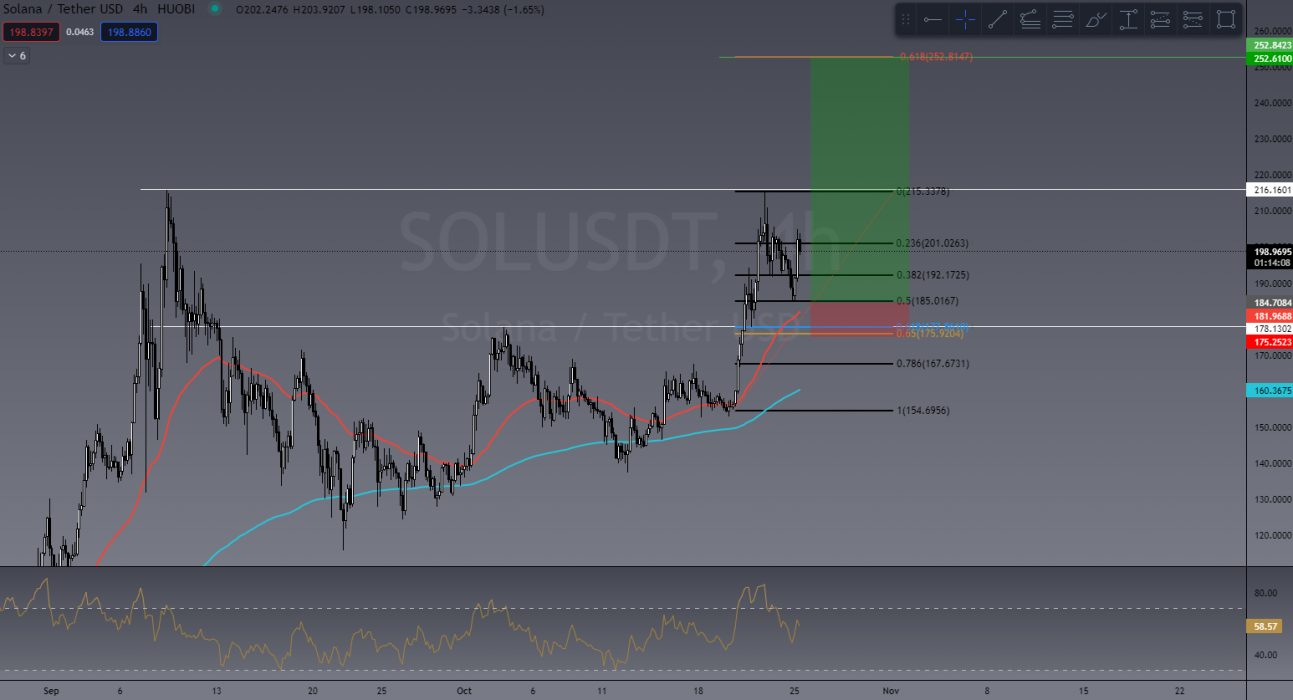
Its hard not to be watching the front runners from last weeks success and like ETH, we agree SOL is still looking very bullish. Market structure is up even after BTC having a little pullback. SOL has tested that 50% Fibonacci level again with a price projection of US$252 in price discovery. If this plays out to plan the key entry on 50% fib has been missed, however SOL certainly has room to move here! Definitely, one to keep a close eye on.
One thing we’ve learnt about trading altcoins is that they are absolutely subject to what BTC is doing. If BTC takes a bullish path we may see the altcoins follow it up, whereas if BTC takes a bearish path we may likely see them follow it down.
If you would like to become a better trader, you are invited to join our TradeRoom where we share daily charts and market analysis. In our community we strongly encourage and teach correct risk management strategies to keep our members safe in this new volatile crypto market.
>> Take our Free Beginners’ Trading Course
>> Join our Trading Community

The Crypto Den was created in 2017 to help the rapidly growing crypto community learn and understand the fundamentals of digital currencies and how to trade them.
Since then we have taught thousands of members the basics of technical analysis and trading strategies to further progress and perfect their trading abilities.
In the TradeRoom you will be included in a supportive environment which encourages personal growth, education and community support.
It’s a place to share your trading ideas and follow other experienced traders’ feeds to help keep your finger on the pulse of such a volatile market!
Disclaimer:
The content and views expressed in the articles are those of the original authors own and are not necessarily the views of Crypto News. We do actively check all our content for accuracy to help protect our readers. This article content and links to external third-parties is included for information and entertainment purposes. It is not financial advice. Please do your own research before participating.
Credit: Source link


