

XRP’s weekly chart is flashing a bearish continuation risk after failing to reclaim the $1.60 area, according to veteran chartist Aksel Kibar, CMT. His latest XRPUSD setup points to a possible extension lower toward $0.75 if the current consolidation breaks down.
Kibar, who posts under the TechCharts account on X, is a Chartered Market Technician and classical chart trader with more than 15 years of experience in global equity market analysis. He’s an ex-fund manager who has worked for Yapi Kredi Bank in Turkey and the National Bank of Abu Dhabi, where he worked as a senior technical analyst and fund manager.
His reputation in technical-analysis circles has also been reinforced by Peter Brandt, the veteran commodity trader and author, who has repeatedly amplified Kibar’s work as “the most accomplished pure classical chart analyst alive today.”
XRP Stalls Below $1.60 Resistance
His latest XRP post was short but direct. “$XRPUSD 1.6 resistance. Latest consolidation below the resistance and can act as a bearish continuation.”
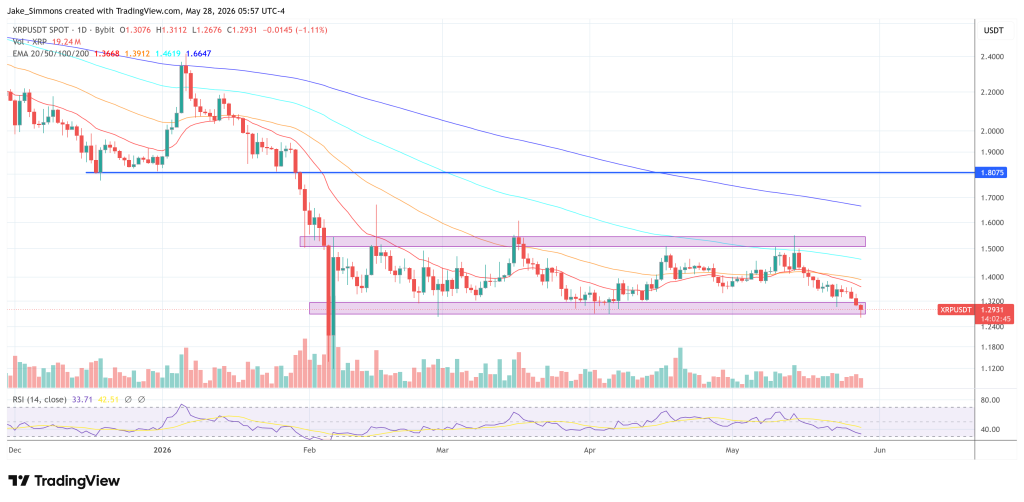
The chart shows XRP on Bitstamp’s weekly timeframe, trading around $1.28 after failing to reclaim the $1.60 region. That level matters because it marks a prior support zone from the broader 2025 range, which extended toward the $3.45 area at the top. Once XRP lost that range support, the same zone began acting as overhead resistance.
Related Reading
The more important detail is the structure forming beneath it. XRP is not merely trading below $1.60; it has been compressing inside what resembles a triangular consolidation. The upper boundary slopes lower from the failed recovery attempt, while the lower boundary rises from the post-breakdown lows.
In classical charting, that kind of structure can resolve either way, but its location matters. A triangle forming after a major breakdown and below former support is often treated as a potential continuation pattern unless buyers force a recovery back above resistance.
Kibar’s $0.75 target appears to come from the pattern’s measured move. The widest part of the triangle spans roughly from $1.67 down to $1.12, giving the structure a height of about $0.55. If XRP breaks below the triangle near the $1.30 area, subtracting that $0.55 range gives a downside objective near $0.75.
That makes the target less arbitrary than a simple horizontal support call. It is the projected extension of the current compression if the market confirms a breakdown. The setup still requires that confirmation. Without a decisive break below the triangle, the chart remains a risk structure rather than a completed bearish signal.
Related Reading
The chart also includes Kibar’s long-term trend filter. In crypto, Kibar is known to use the 365-day exponential moving average as a primary directional filter rather than as a standalone buy or sell trigger. Price above that average generally supports a more constructive bias; price below it argues for caution, particularly when rallies stall below resistance.
In XRP’s case, price is trading below the red long-term moving average at $1.74, while the average itself sits above the current consolidation. That adds another layer to the bearish interpretation. Buyers not only need to invalidate the triangle breakdown risk; they also need to repair the broader trend structure by reclaiming lost resistance and moving back above the long-term average.
At press time, XRP traded at $1.29.
Featured image created with DALL.E, chart from TradingView.com
Credit: Source link