


DeFi is having one of its most difficult weeks in recent memory. What started as a single exploit on April 19 has since cascaded into a system-wide liquidity shock that has rattled confidence across the ecosystem and raised questions that go well beyond the incident itself.
Related Reading
The event began at Kelp DAO, where an attacker identified and exploited a critical flaw in the protocol’s collateral system. To understand what happened, it helps to understand what rsETH is supposed to be. Under normal conditions, rsETH is minted when a user deposits ETH as staking collateral — it functions as a receipt, backed 1-to-1 by the underlying asset. The design is straightforward: deposit real ETH, receive a token representing it.
The attacker found a way around that requirement entirely. By exploiting a flaw in the system, they minted rsETH without depositing any ETH at all — creating tokens that looked legitimate but were backed by nothing.
Those tokens were then deposited as collateral on Aave, one of DeFi’s largest and most trusted lending protocols, and used to borrow real assets: actual ETH, actual stablecoins. The result was up to $230 million in potential bad debt sitting inside a protocol that had no role in creating it.
The exploit itself lasted hours. The damage it triggered is still unfolding.
$15 Billion Left in Three Days. The Numbers Tell the Rest
The market’s response to the exploit was swift and unambiguous. According to XWIN Research Japan, Aave’s total value locked fell from approximately $45 billion to $30 billion in just three days — a 33% decline representing $15 billion in deposits withdrawn by users who decided the risk was no longer acceptable. That pace of exit does not reflect orderly risk management. It reflects fear.
The stress showed up across the system simultaneously. Borrowing rates for USDT and USDC surged from approximately 3.4% to 14% as demand for liquidity spiked against a shrinking supply of available capital.
Taken together, the data describes something more serious than a price correction. It describes a confidence withdrawal — users and capital are moving away from DeFi, not because prices fell, but because the event raised doubts about whether the protocols they trusted were adequately designed to prevent exactly this kind of outcome.
XWIN Research Japan frames the recovery challenge with precision: the issue is not price volatility, it is trust. Stronger protocol security, better collateral diversification, and more resilient liquidity design are the prerequisites — but none of them matter until users believe the system has genuinely changed. In DeFi, trust is not a soft metric. It is the entire foundation.
Related Reading
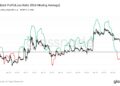
AAVE Struggles to Stabilize as Downtrend Structure Remains Intact
AAVE continues to trade under a clear bearish structure. The price is hovering near the $90–$95 region after failing to sustain a recent relief bounce. The daily chart shows a persistent sequence of lower highs and lower lows since late 2025. Confirming that the broader trend remains firmly to the downside despite intermittent recovery attempts.

The latest move highlights that weakness. AAVE briefly pushed toward the $110–$115 area, testing the declining 50-day moving average, but was rejected quickly and sold back into its prior range. That rejection reinforces the role of dynamic resistance. Both the 50-day and 100-day moving averages are trending downward, capping upside momentum.
Related Reading
Volume behavior adds context. The recent spike in selling volume during the drop back toward $90 suggests active distribution rather than passive drift lower. Buyers have stepped in around this level multiple times. Establishing it as short-term support, but the lack of follow-through on rebounds indicates limited conviction.
If $90 fails to hold, the structure opens the door to a deeper move toward the $80 region, where the next meaningful demand zone likely sits. On the upside, AAVE would need to reclaim $110 with strength to begin challenging the broader downtrend. Until then, rallies appear corrective rather than structural reversals.
Featured image from ChatGPT, chart from TradingView.com
Credit: Source link


